Coffee research (all articles)

Espresso is a deceptively complex system. Small changes in puck preparation, flow, pressure, basket geometry, temperature, or roast development can produce measurable—and sometimes surprising—differences in extraction and taste. The aim of this research has been to isolate those variables where possible, measure their effects, and turn observations from the cup and the machine into a clearer understanding of what is actually happening during an espresso shot.
This page brings that work together in one place. The articles below cover four closely related areas: understanding the mechanics of espresso extraction, improving puck preparation, developing and comparing extraction profiles, and evaluating the effect of baskets and other accessories.
Trying to better understand espresso extraction
Preinfusion: basic principles, preinfusion on a Decent, and PCT ratio
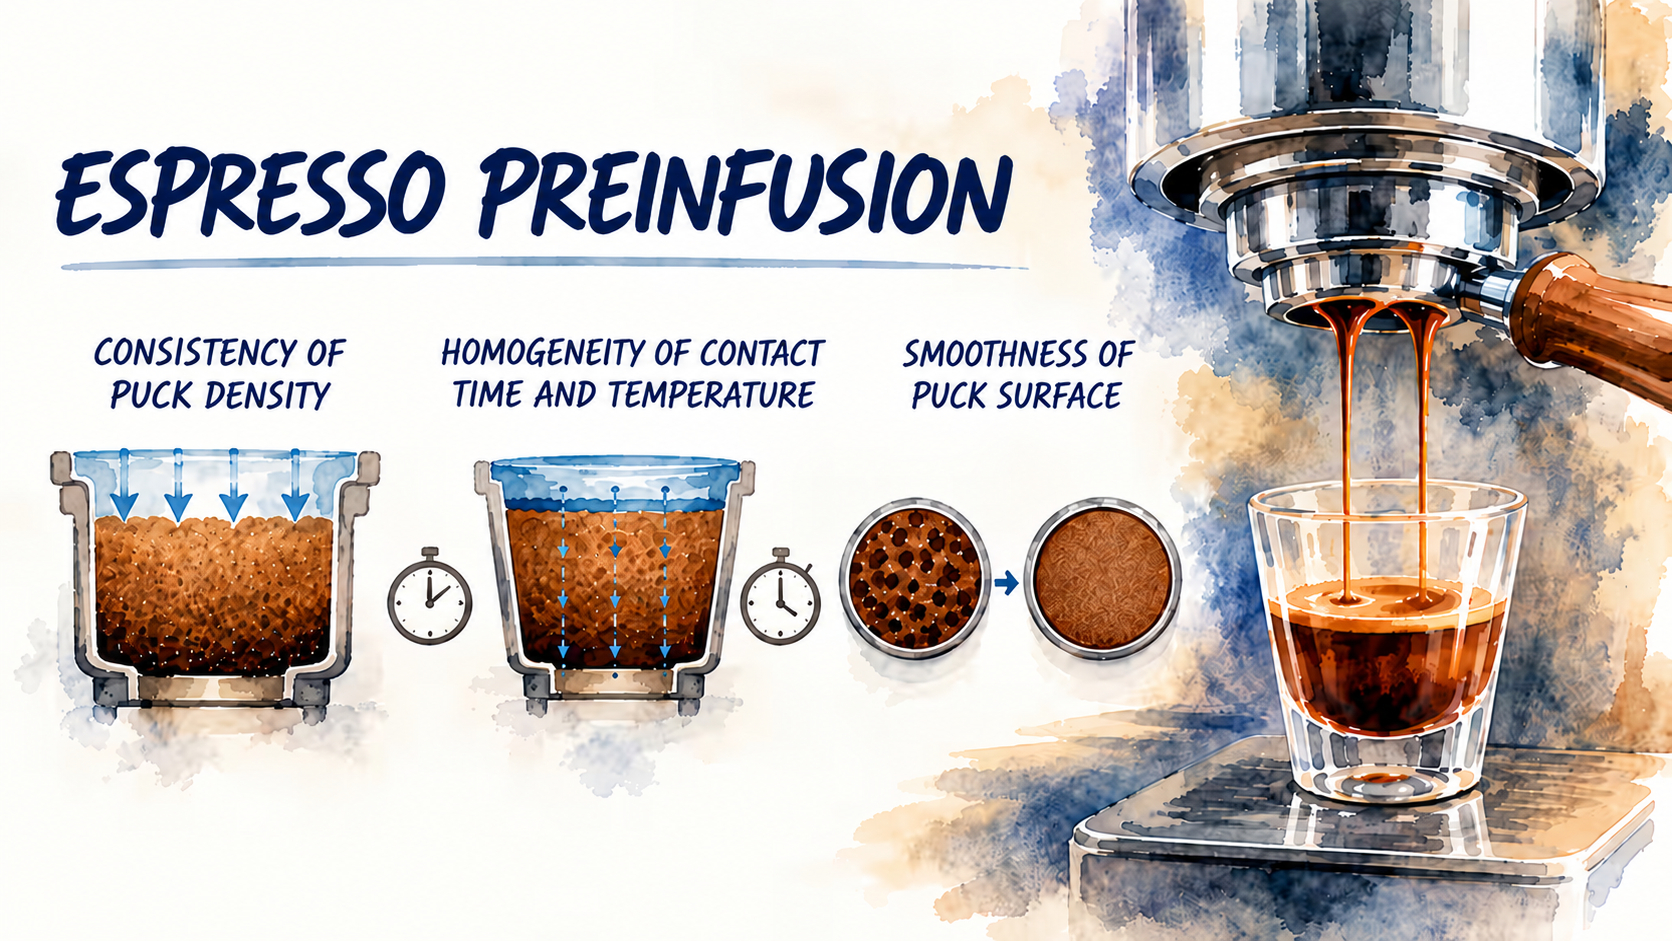
This article is based on research and a presentation by Stéphane Ribes from May 2019.
1. Introduction
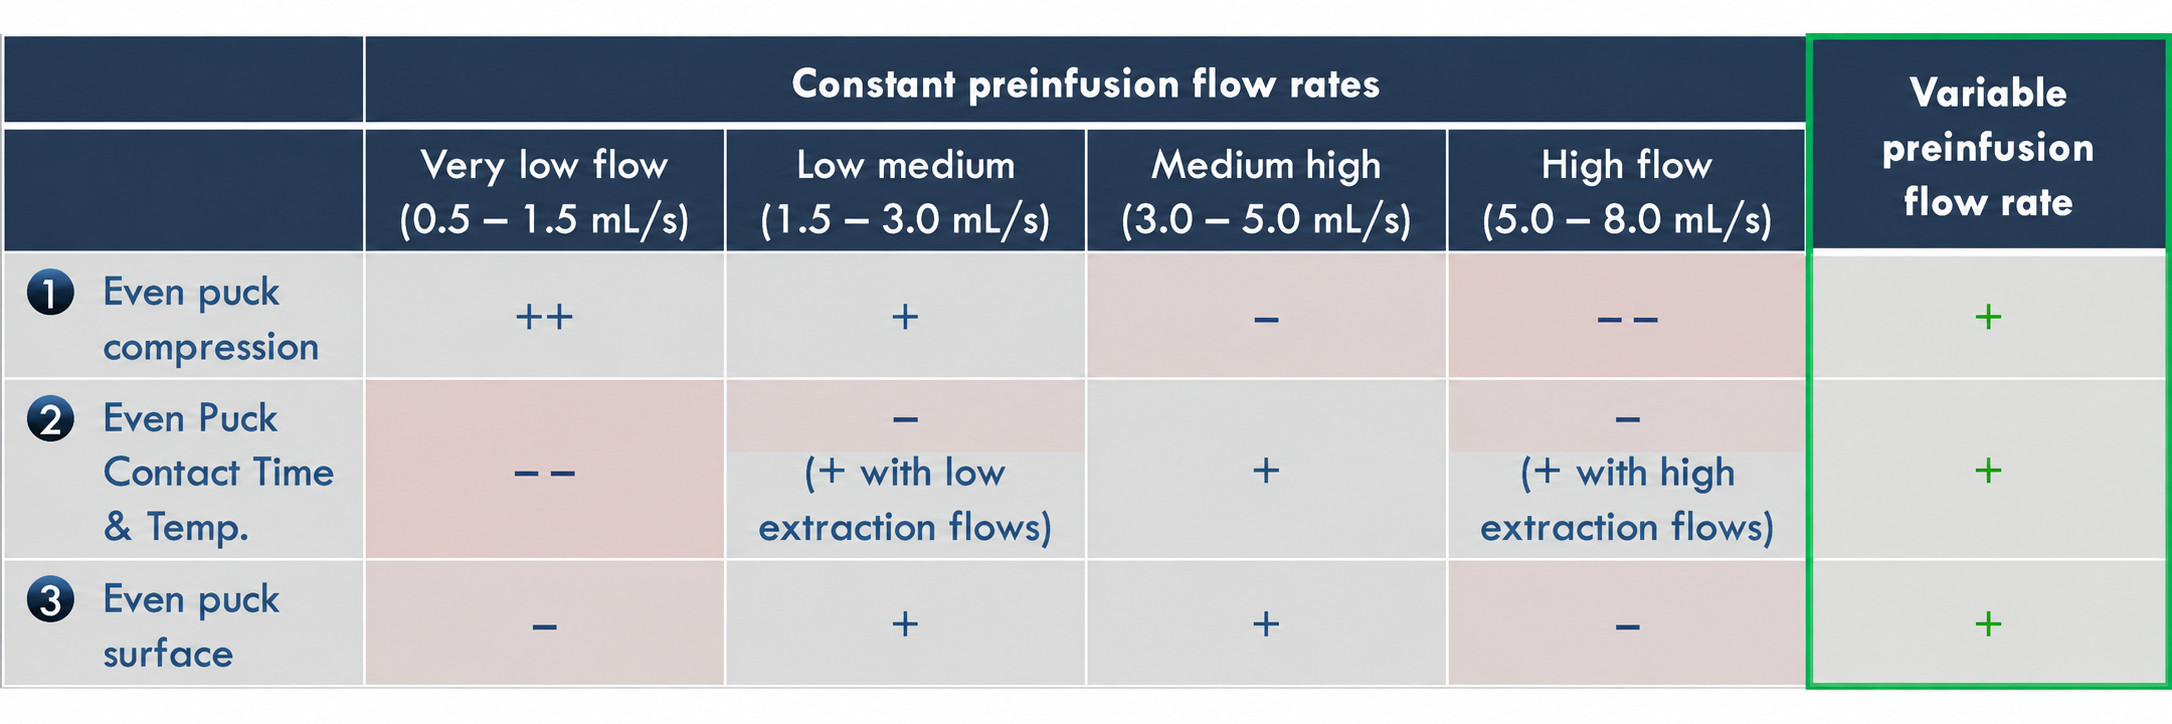
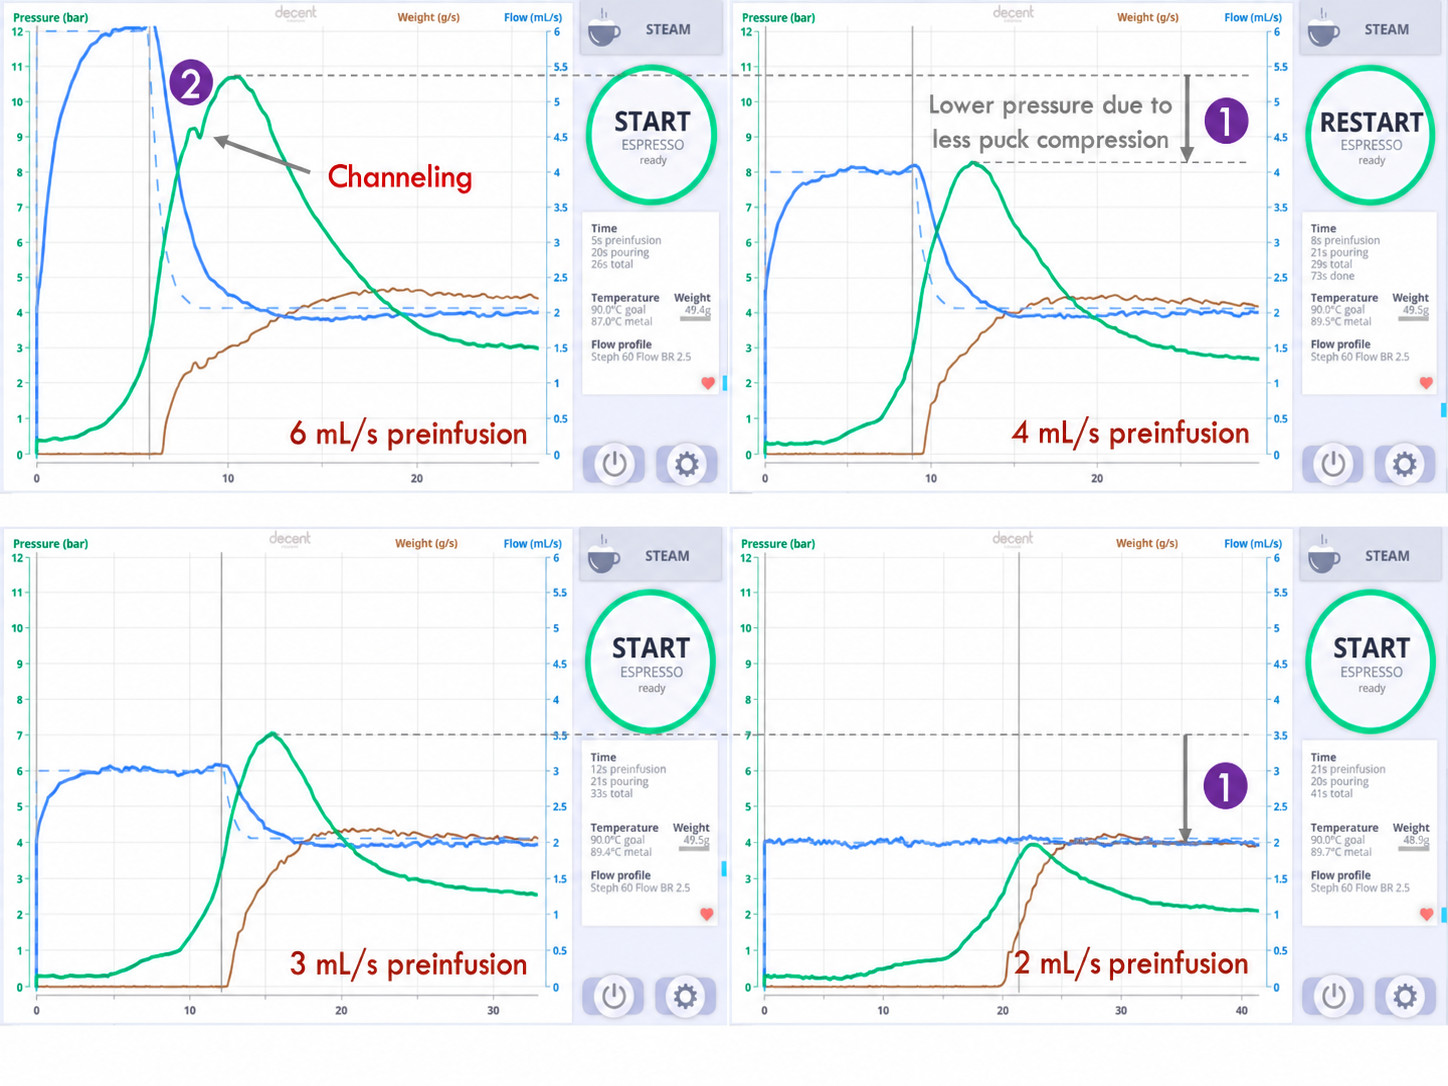
Ideal preinfusion involves the rapid and uniform wetting of ground coffee grinds to establish consistent puck compression, thermal homogeneity, and fluid velocity prior to main extraction. Traditional single-direction water delivery methods often fail to achieve this uniformity. Utilizing the Decent Espresso (DE1) platform, this research by Stéphane Ribes (May 2019) investigates how altering preinfusion flow rates (0.5 mL/s to 8.0mL/s), pressure transition thresholds, and multi-step preinfusion profiles impacts physical puck behavior, extraction dynamics, and the Puck Contact Time (PCT) ratio.
2. Summary
What is preinfusion?
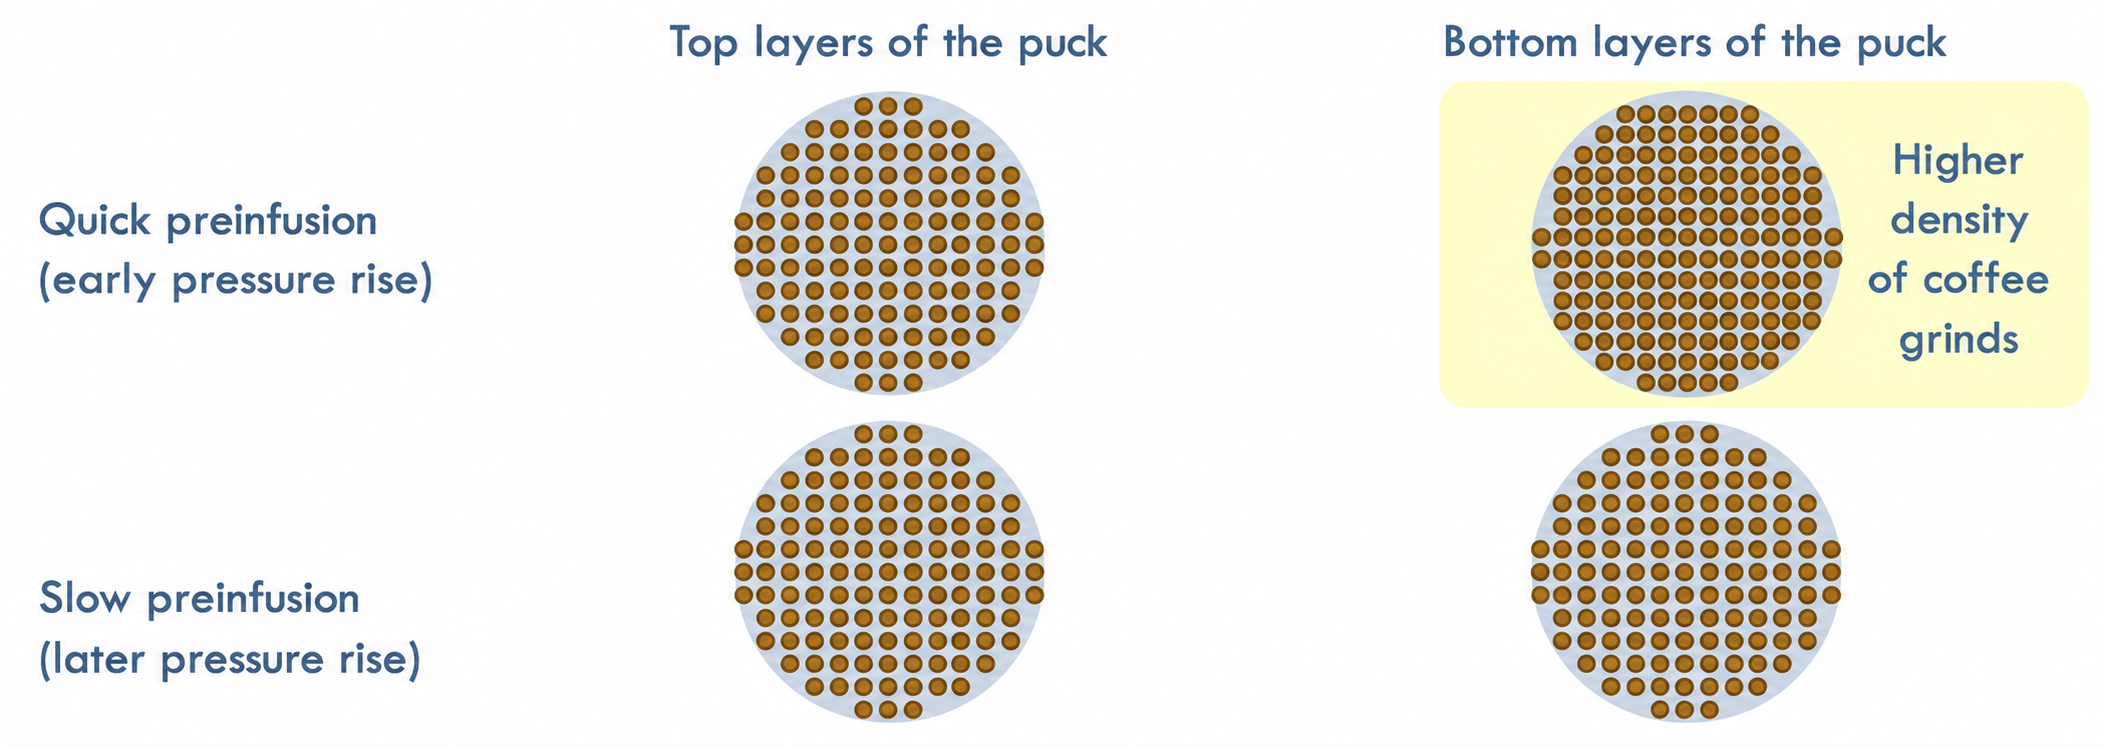
Perfect preinfusion consists in instantaneous and even wetting of the coffee grinds. Its outcome is a totally wet puck, with even temperature and compression.
With the Decent Espresso machine, espresso preinfusion can easily be adjusted and perfected.
3. Questions asked
4. Method
5. Proceeding
6. All the experiments
6.1. Even puck density
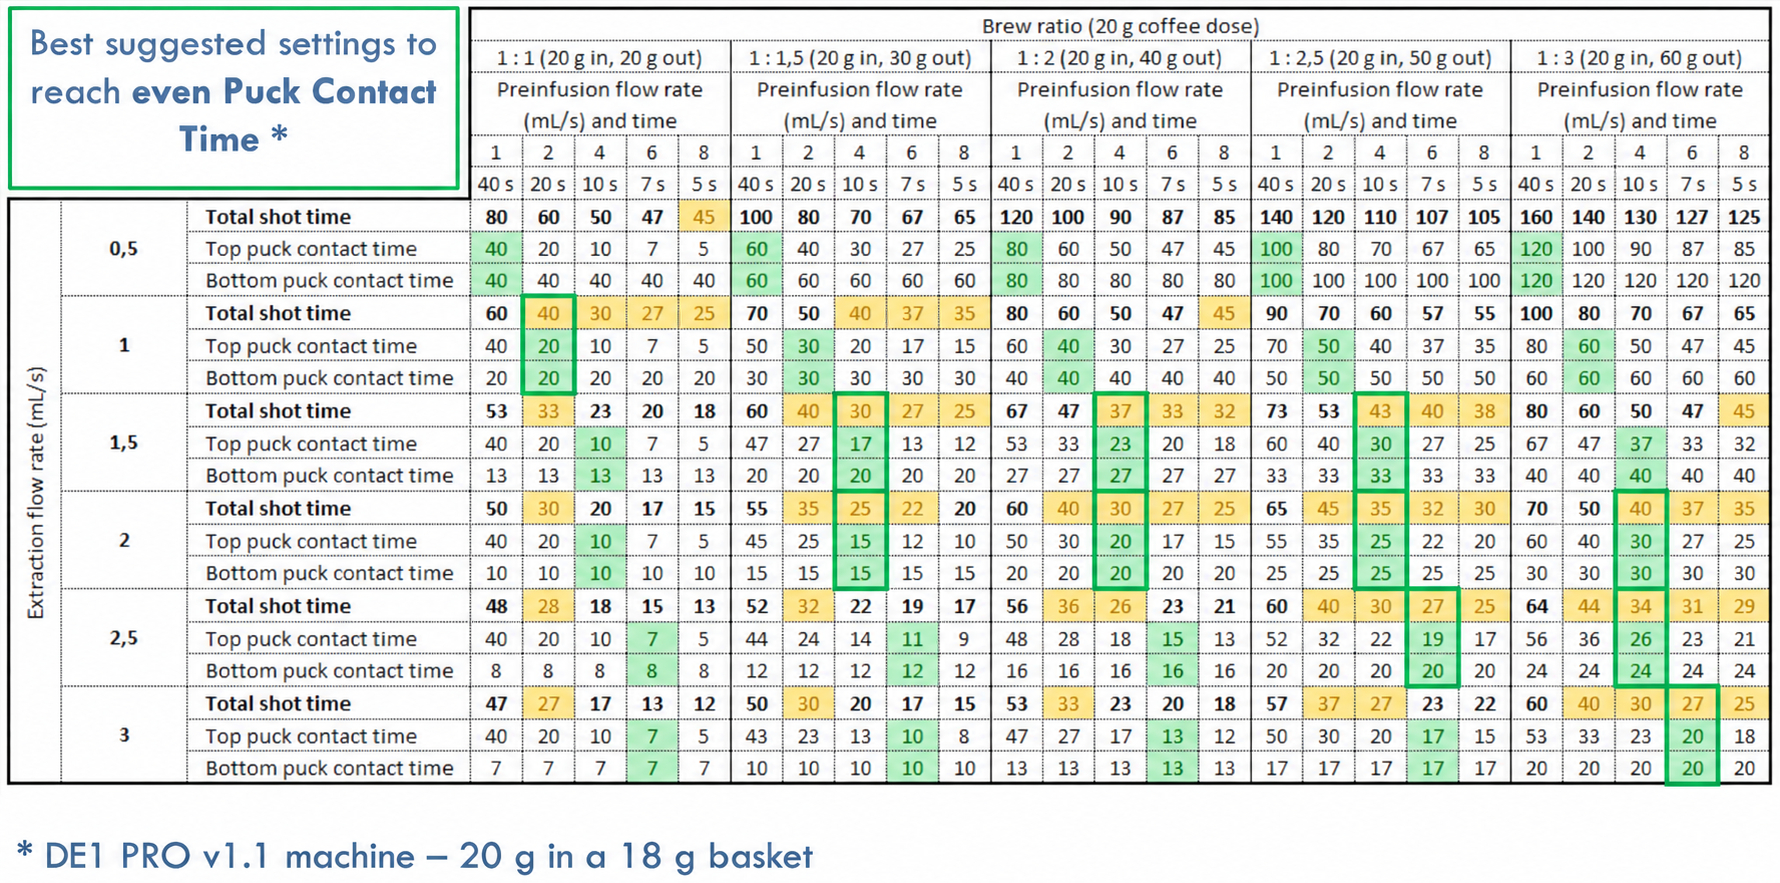
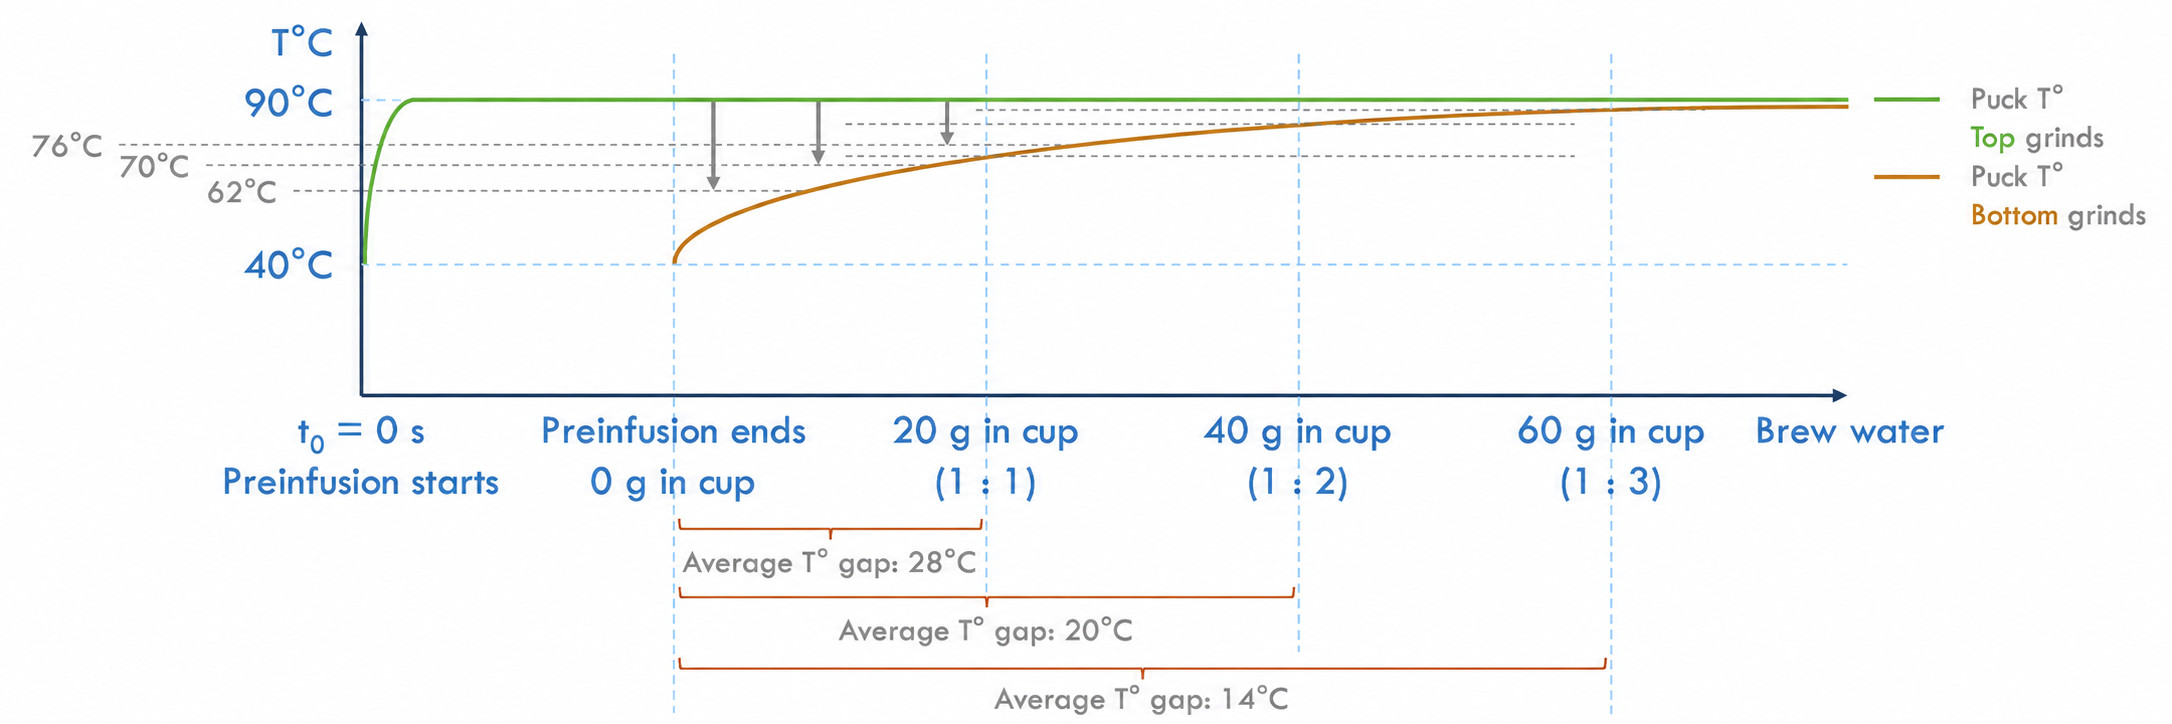
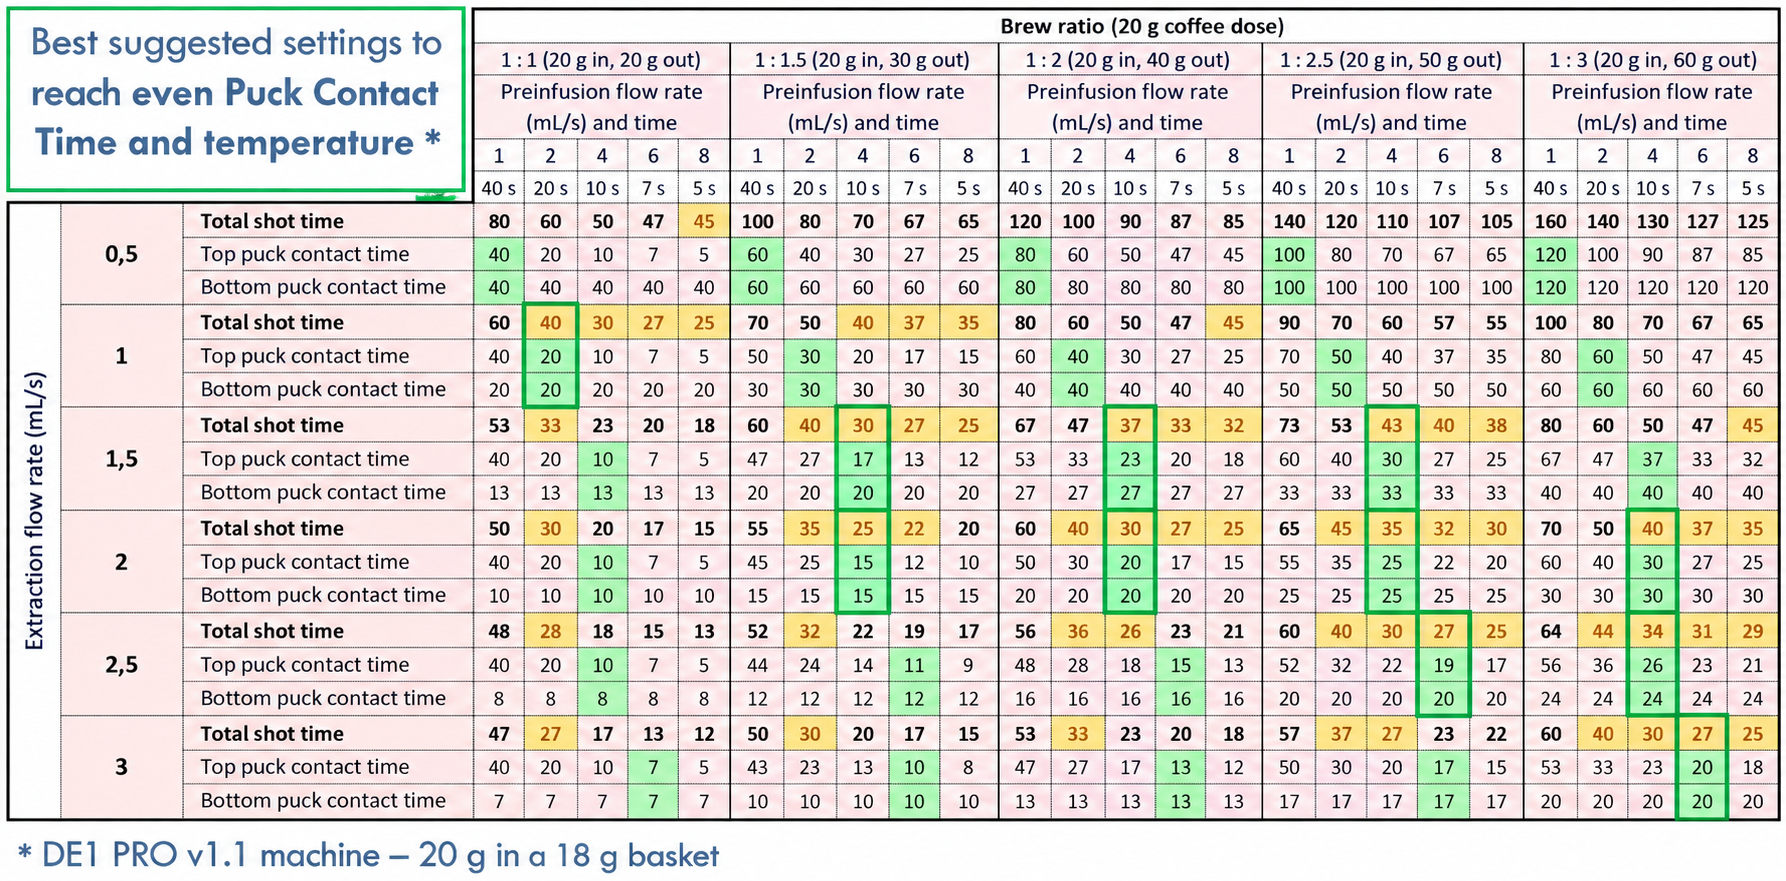
6.2. Even contact time & temperature
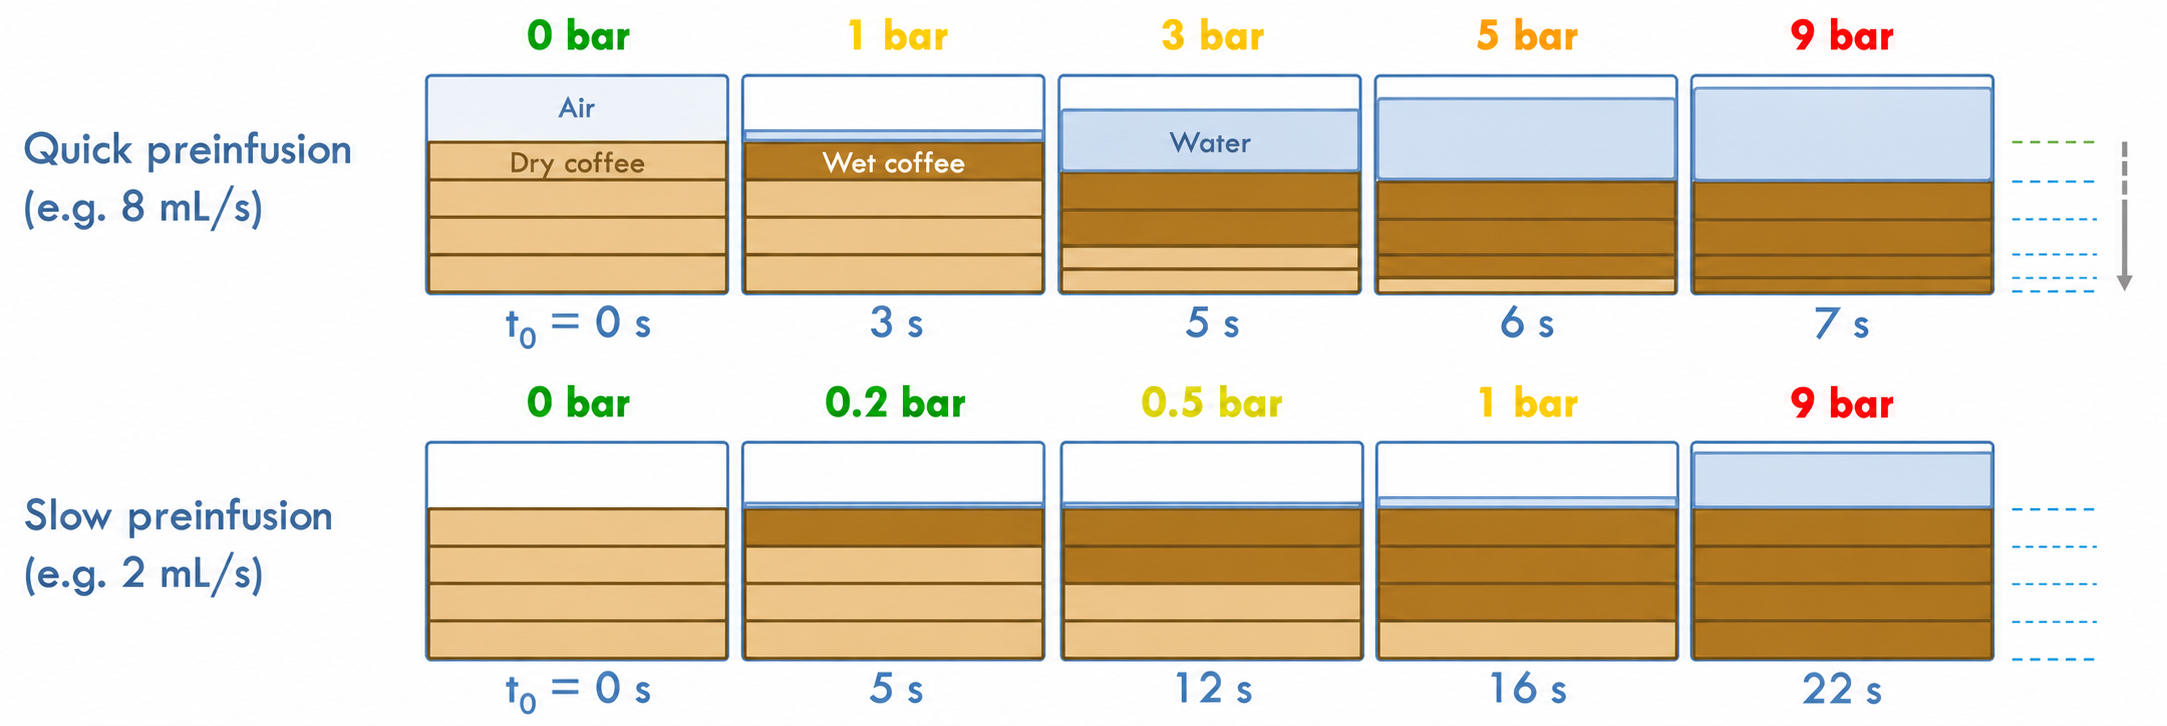
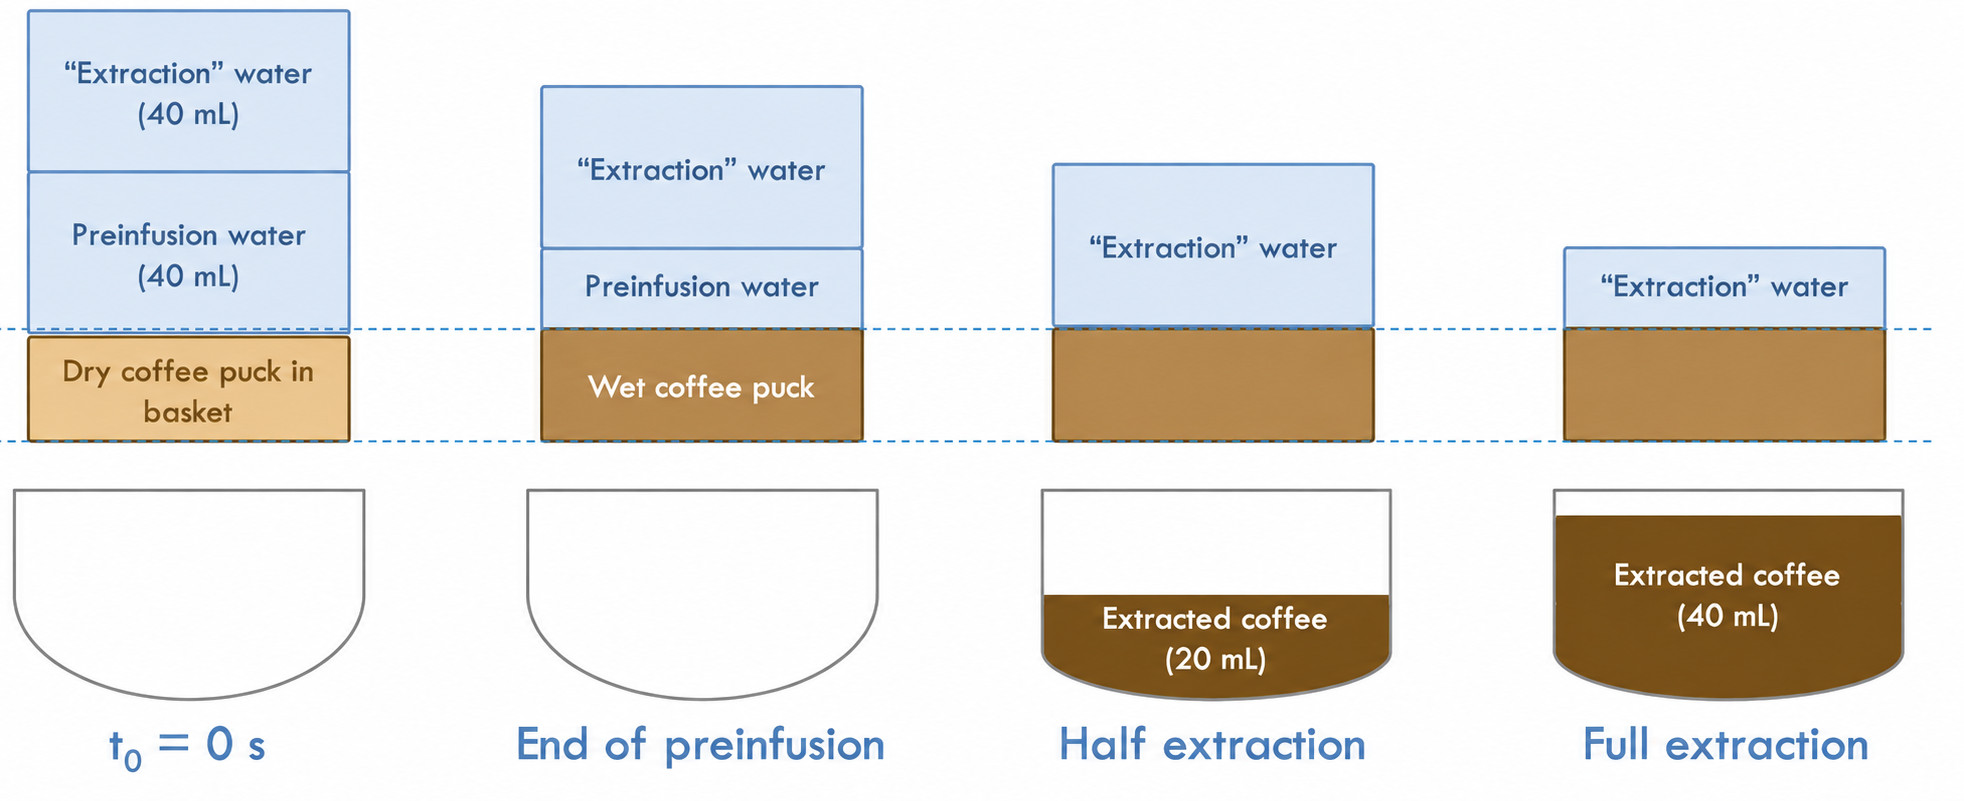
With the Decent Espresso machine, a 20g coffee dose requires ca. 40mL of water to perform full preinfusion (DE1 PRO v1.1 machine – 20g of coffee in an 18g basket).

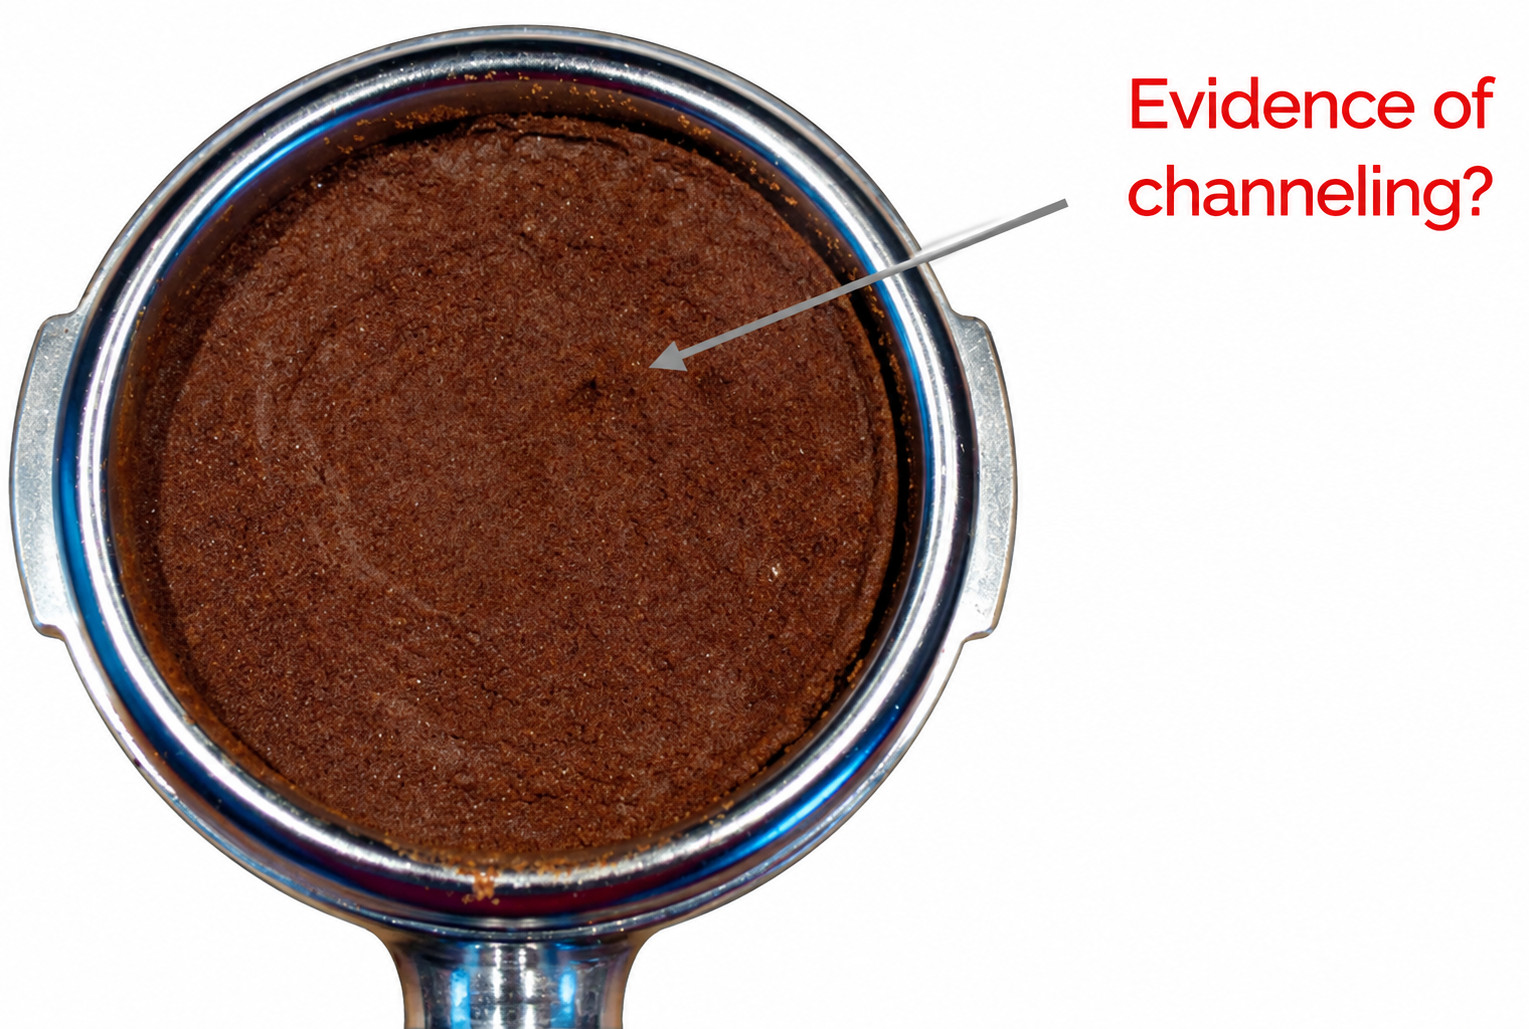
6.3. Even puck surface after preinfusion
Espresso preinfusion: How to make it more decent
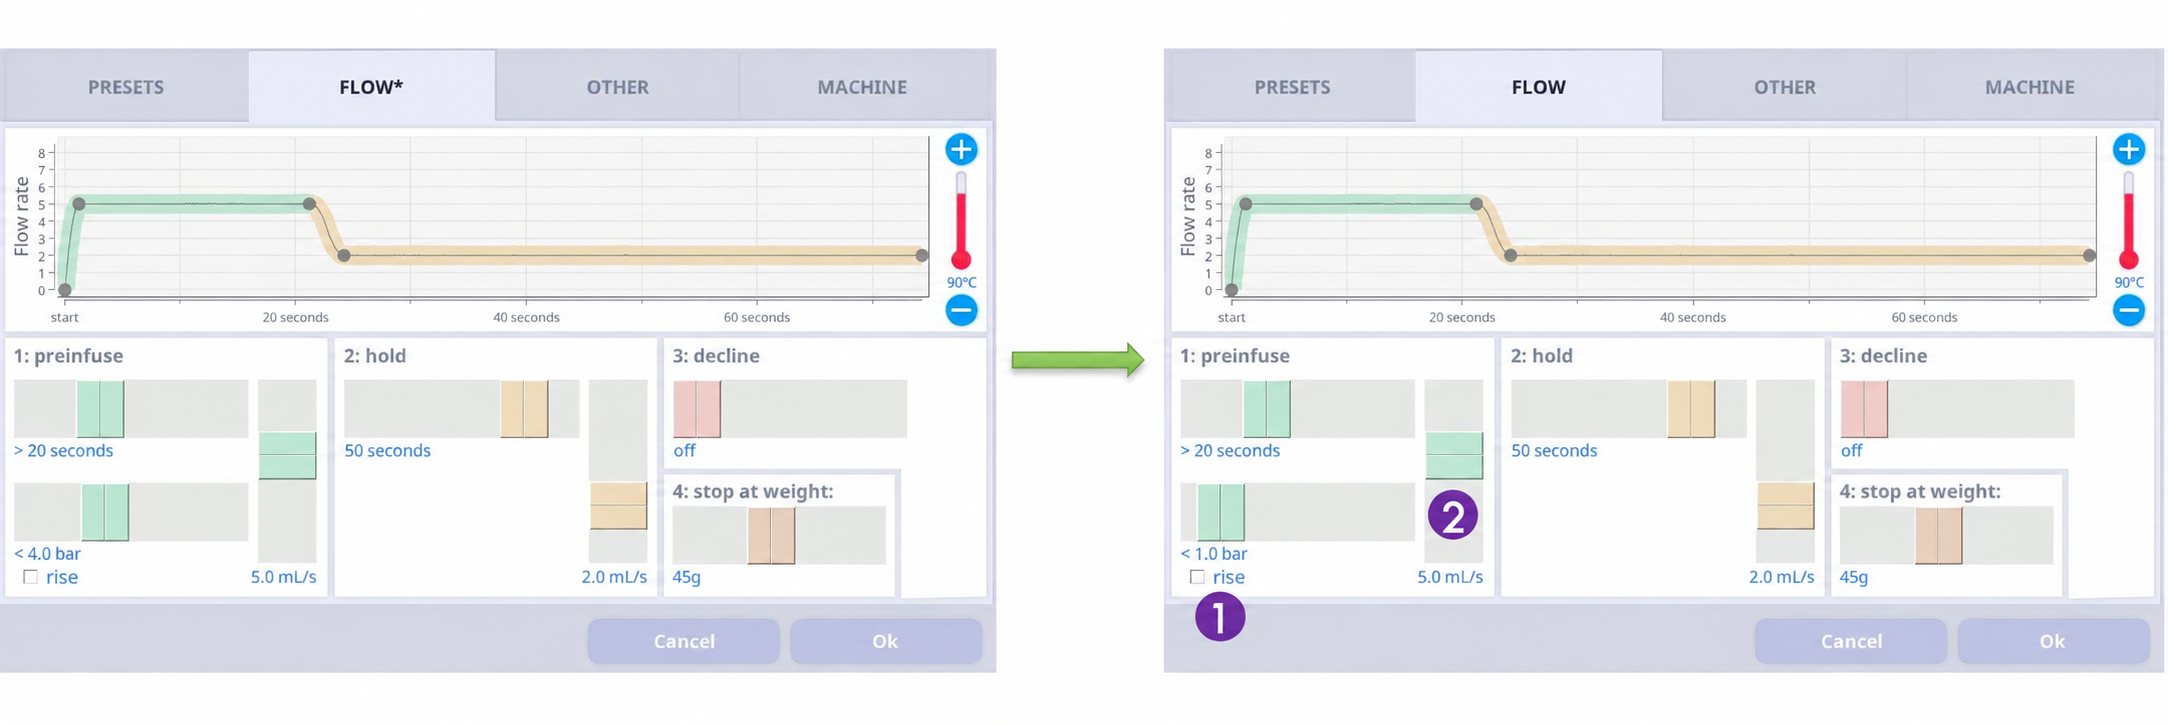
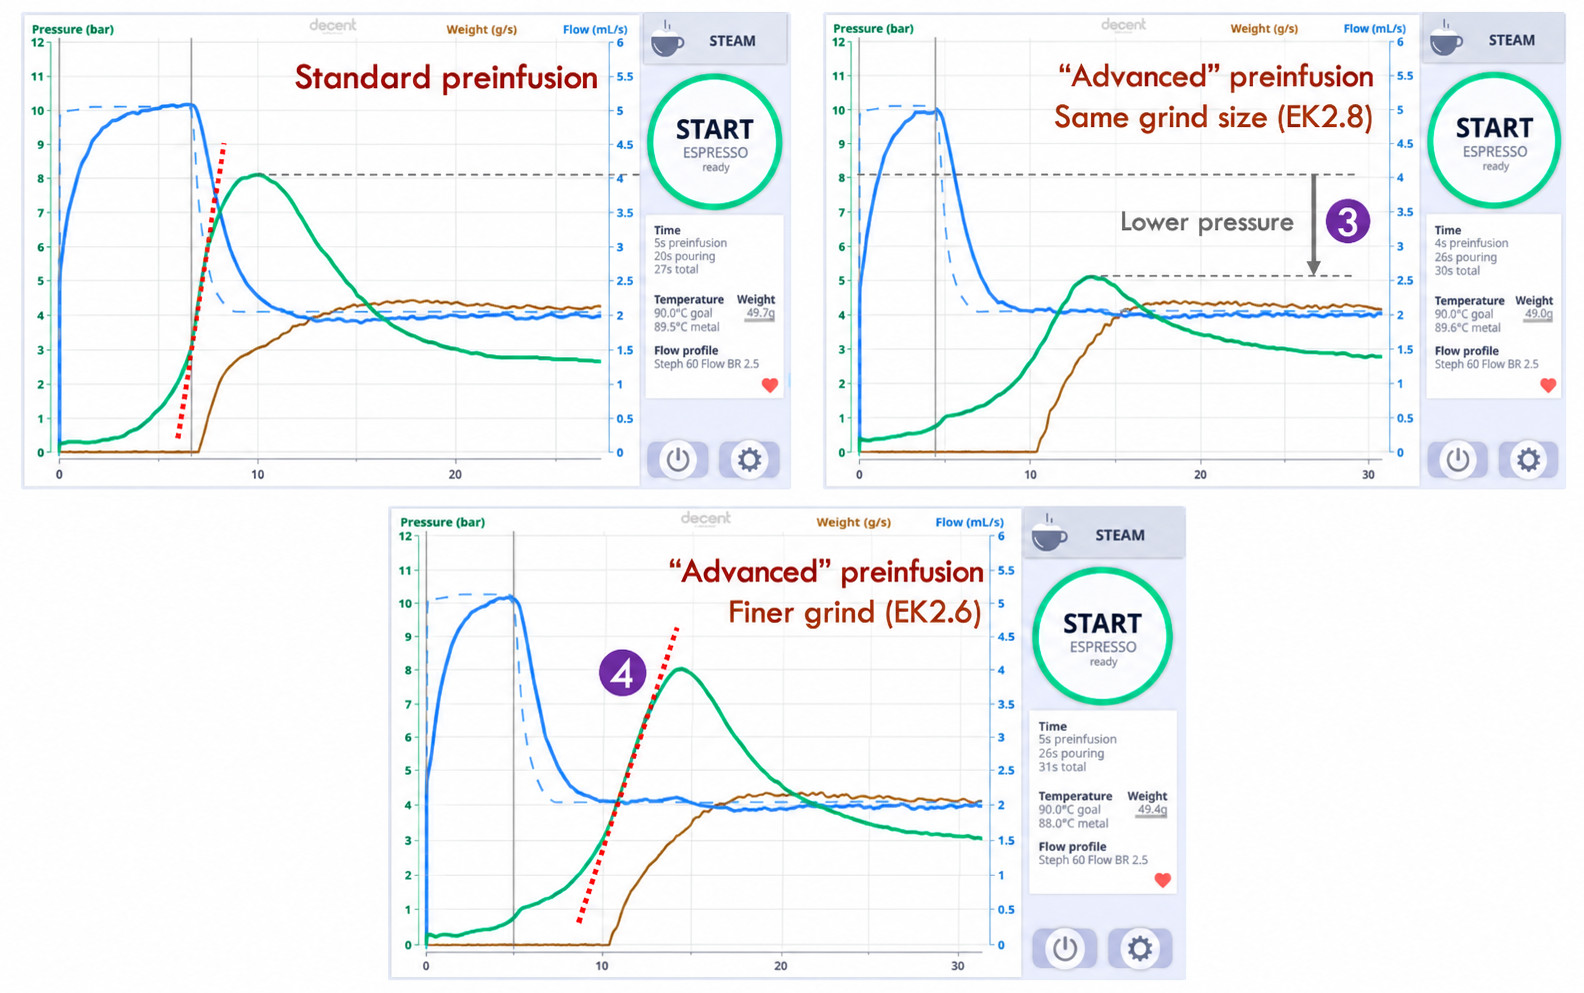
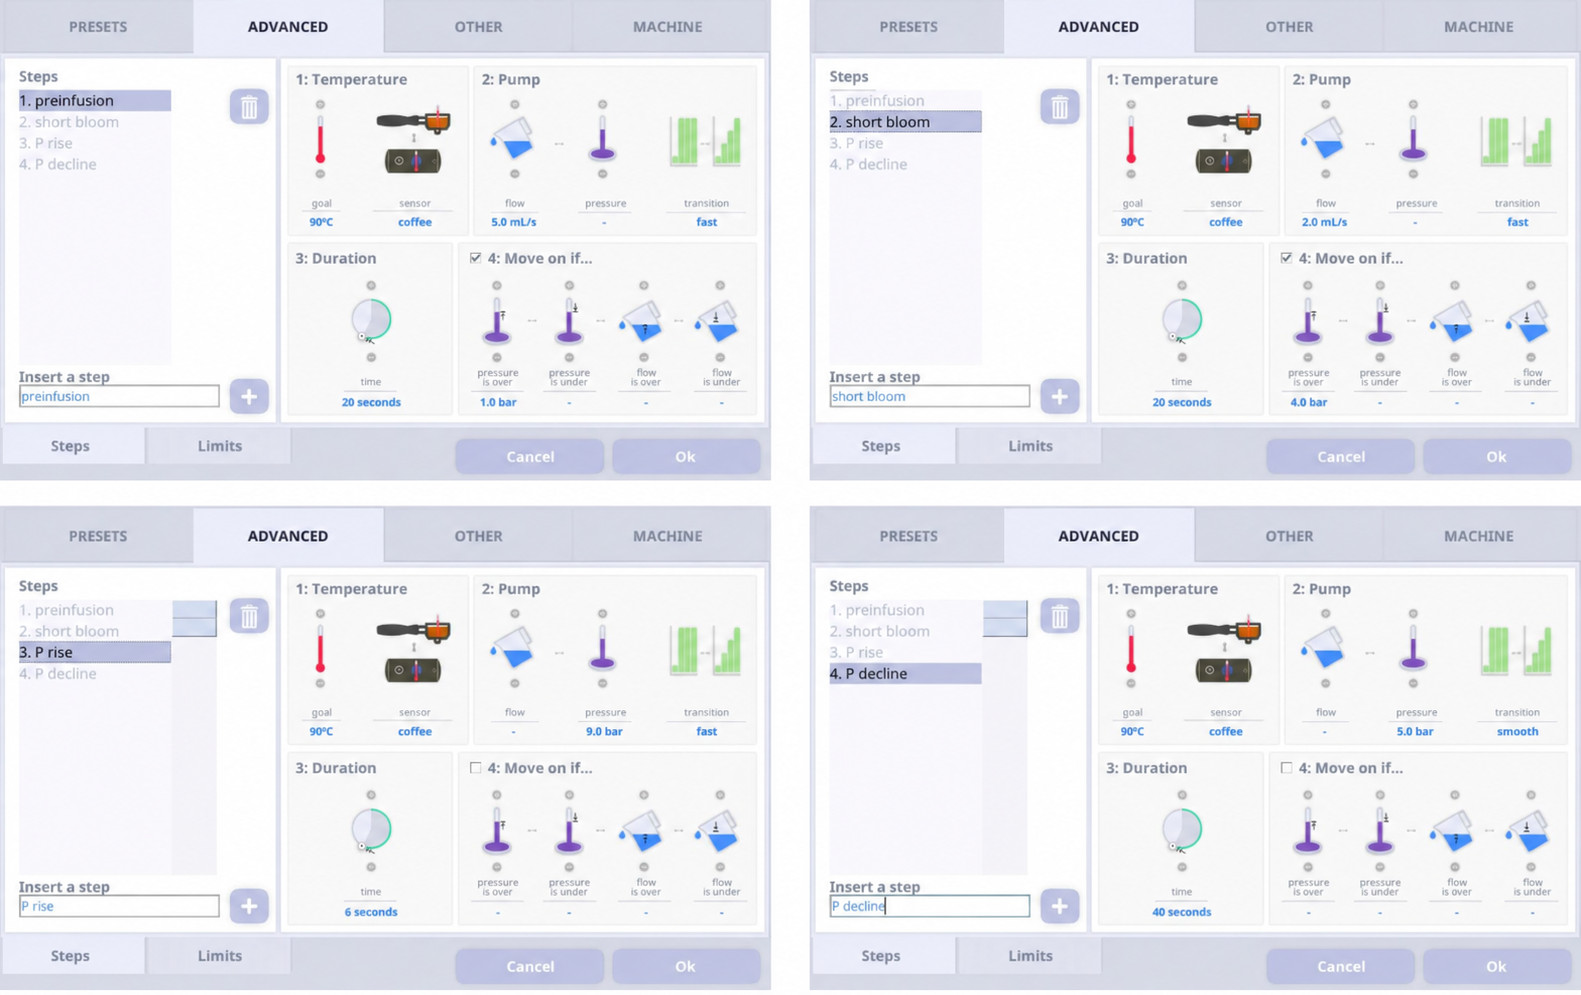
With the Decent Espresso machine, the preinfusion process can easily be modified to benefit from the best of each flow rate family and improve the overall preinfusion performance.
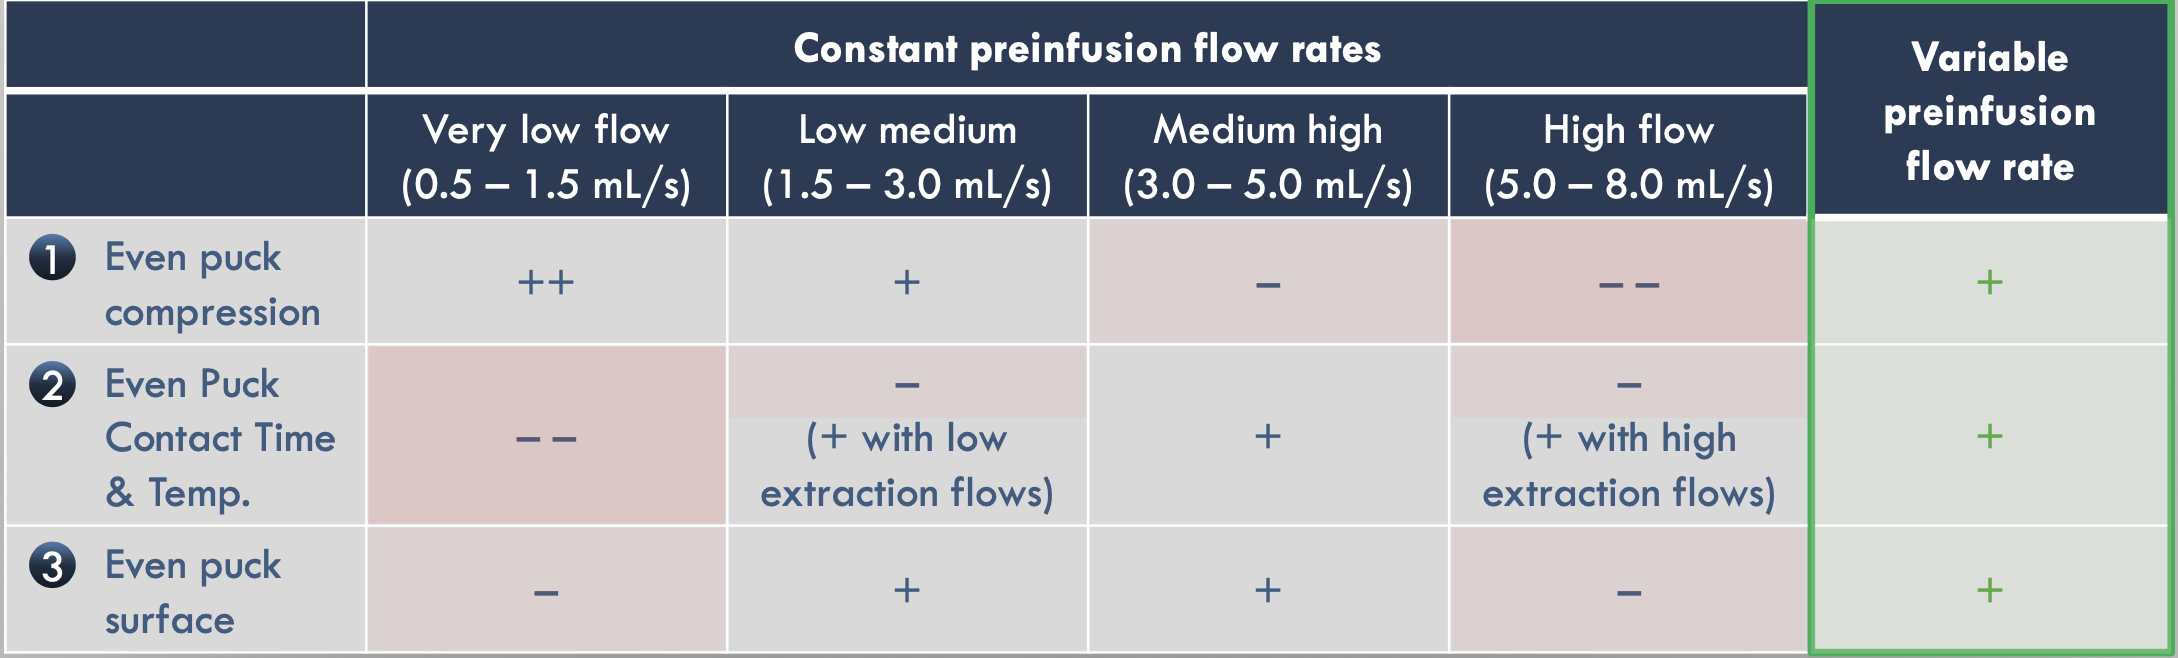
Advanced Decent preinfusion
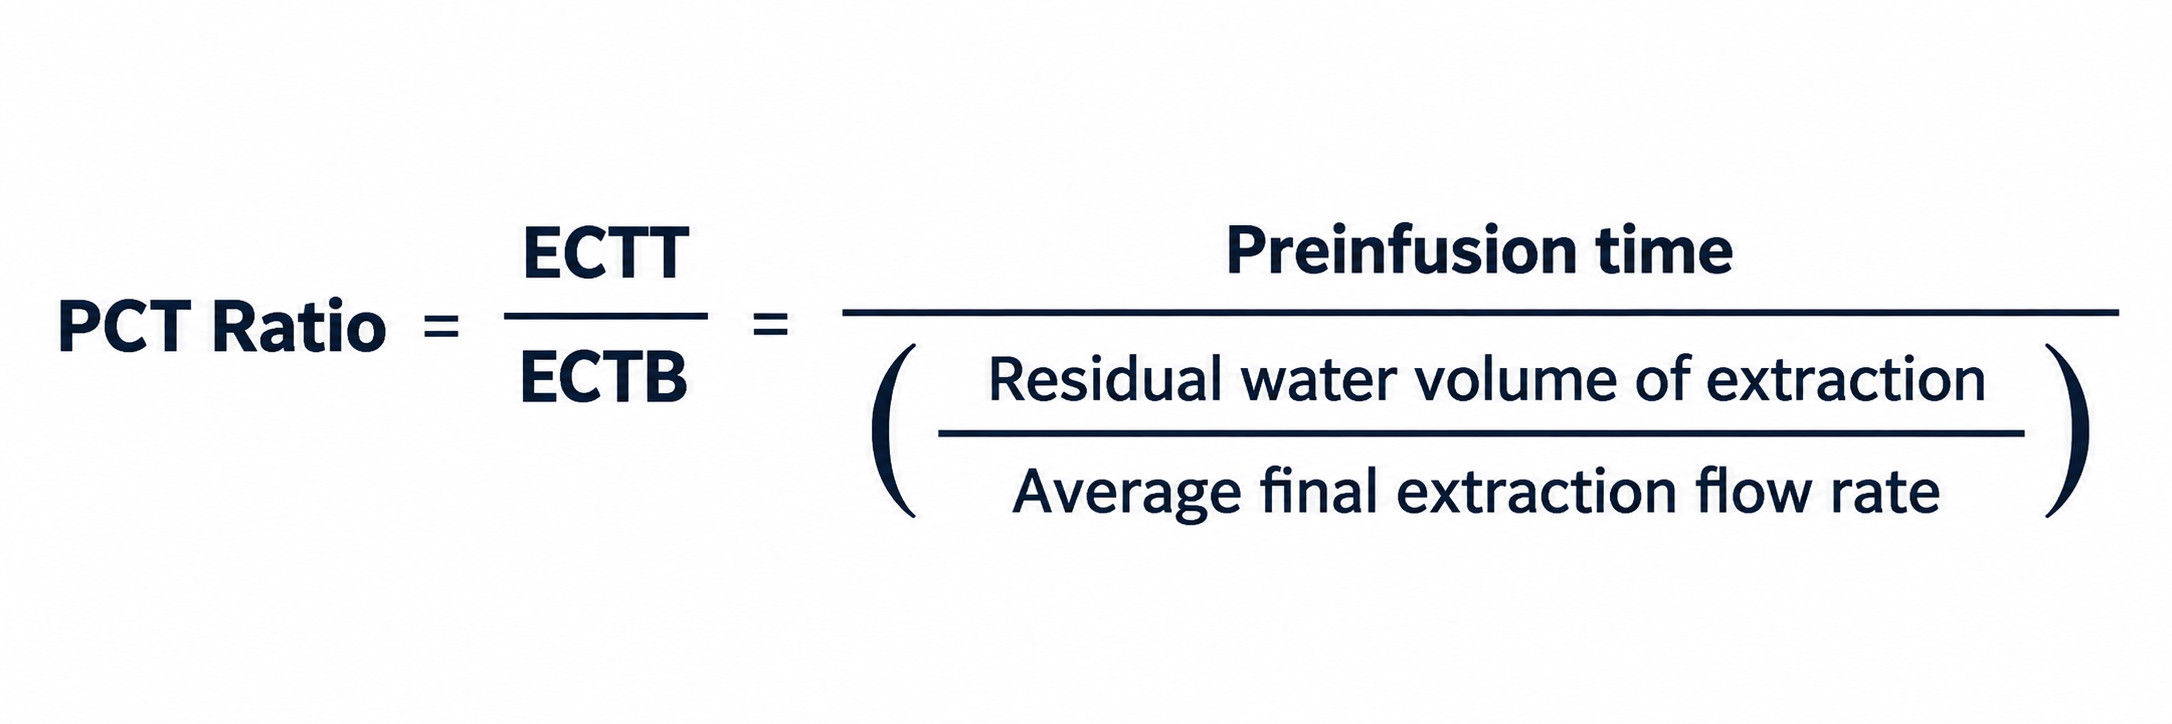
How good is your Puck Contact Time (PCT) ratio?
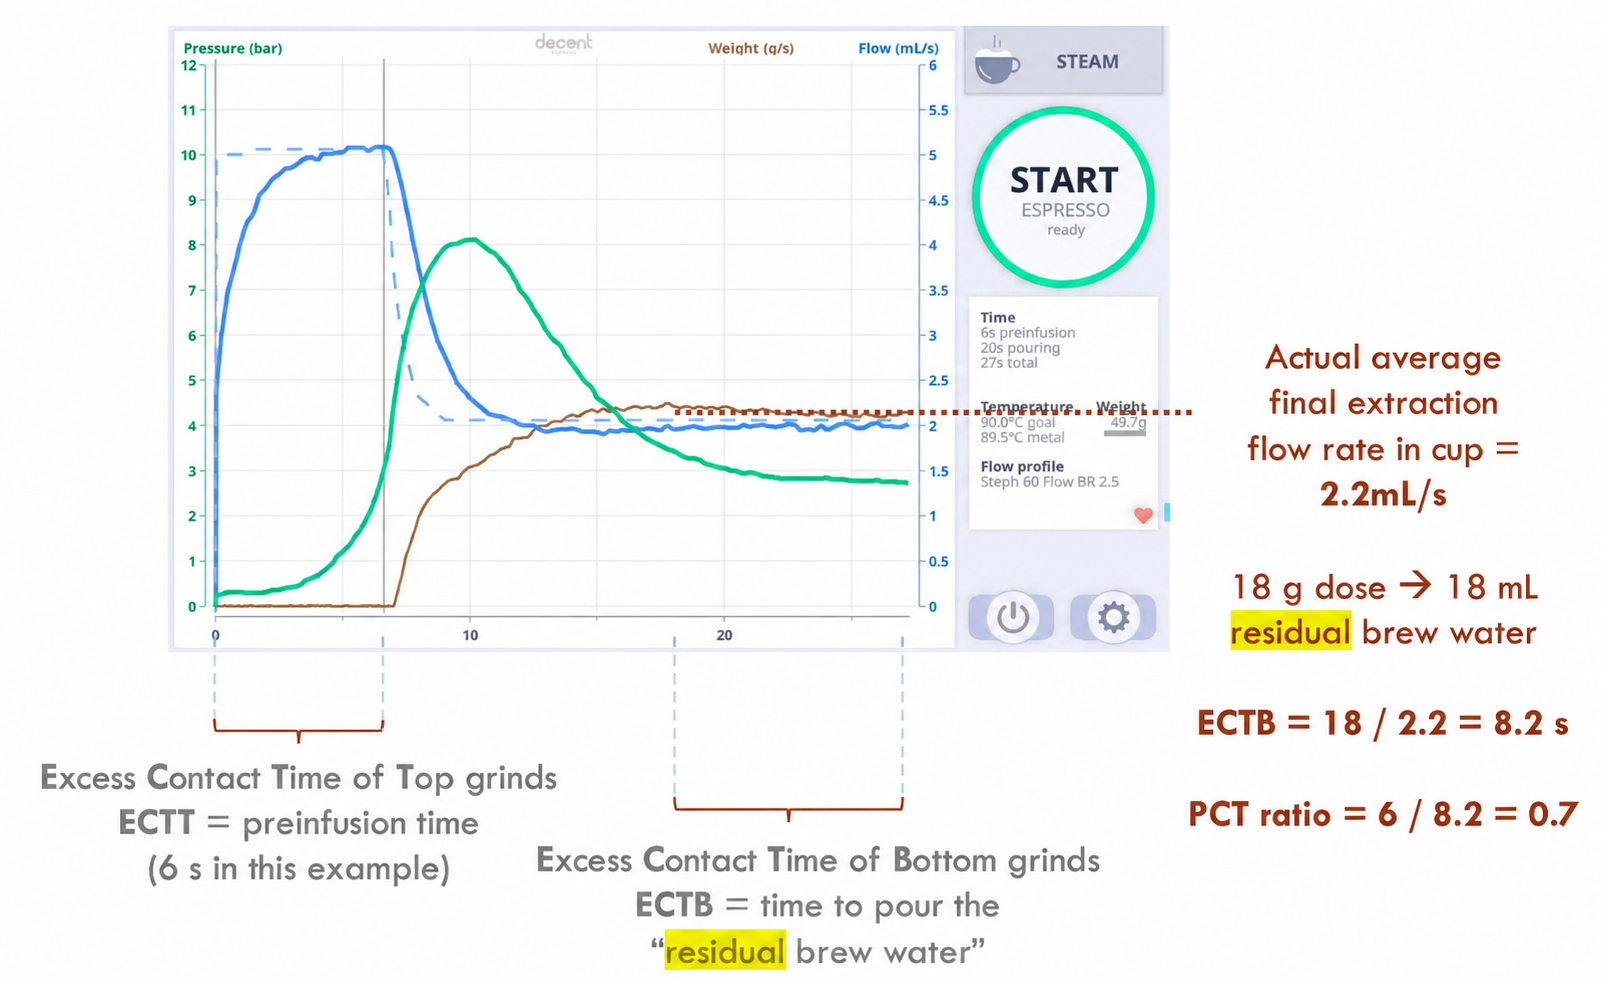
PCT ratio = ECTT / ECTB
7. Results, summarized
8. Conclusion
In conclusion, the questions brought up under the chapter "Questions" can be answered as follows:
(1)Probably slightly less if puck erosion was considered (not taken into account here)
(2)Probably slightly less if puck erosion was considered (not taken into account here)
It's almost a blind basket: A first step to better understand a pressure curve during espresso

This article is based on research by Stéphane Ribes, from a presentation in June 2019, which you can find here.
1. Introduction
Pressure during espresso extraction is not determined only by the resistance of the coffee puck. Rather, the compression of the air trapped above the puck is a major factor governing the initial pressure curve. Three variables determine this compression: the initial headspace (1), the water flow supplied by the pump (2), and the water flow entering the coffee puck (3).

Considering a perfect gas model, the following formula can be established:

Blind-basket experiments with a DE1PRO showed acceptable agreement with this model.
Definitions:
2. Questions asked
The following questions can be inferred from Ribes' presentation:
3. Method
Tests were carried out with a DE1PRO v1.1 Decent Espresso machine. Blind-basket experiments isolated the effects of headspace and pump flow. Headspace was varied by adding water to the blind basket, producing estimated air volumes of 36, 26, 16 and 10 cm³.
Flow-rate experiments used initial rates of 1.0, 1.5, 2.0 and 4.0 mL/s. In these tests, water flow was switched to 0 mL/s when pressure reached 7 bar.
Coffee-puck experiments used 12 g in a 15 g VST basket, an IMS SI 200 IM shower screen, and EK43 grind settings from 0.9 to 1.2. Further practical comparisons investigated different basket sizes and IMS CI 200 versus SI 200 shower screens.
4. Proceeding
First, the blind basket was used to determine how changing the trapped air volume alters pressure build-up independently of coffee. Second, the pump flow was varied while headspace remained comparable. Third, coffee was introduced to separate the effect of water entering the puck from the effect of puck resistance itself. Finally, basket size and shower-screen configurations were changed to examine whether these principles also explain differences observed in realistic espresso preparations.
5. Results
5.1. Effect of headspace
The graph below shows a clear positive relationship between headspace and the time required to reach 7 bar at 1 mL/s.
Approximately 10 cm³ required 15 s, 16 cm³ about 21 s, 26 cm³ about 28 s, and 36 cm³ about 32 s. Thus, a smaller trapped air volume is compressed more rapidly and causes pressure to rise sooner and more steeply.

In other words, as headspace decreases, the time required to reach 7 bar at 1 mL/s decreases significantly.
5.2. Effect of water-flow rate
The inverse relationship with flow rate is even stronger. The time to 7 bar fell from roughly 32 s at 1 mL/s to 23 s at 1.5 mL/s, 17 s at 2 mL/s, and only 9 s at 4 mL/s. Higher flow also produced progressively greater pressure overshoot after the 7-bar shut-off trigger, showing that the hydraulic system continues to respond after pump flow is stopped.

In other words, higher input water flow rates significantly reduce the time needed to reach 7 bar. Also, more pressure overshoot occurs as the input water flow rate increases.
5.3. Effects of grind size and puck penetration
Changing the EK43 setting from 0.9 to 1.2 produced a large decrease in maximum extraction pressure, from approximately 12 bar to 3–4 bar. In contrast, the additional time needed to reach 3 bar compared with the blind basket stayed close to 4.5–5.0 s. An excessively fine grind produced a pressure curve resembling the corresponding blind-basket curve, shifted later in time. Most of this initial delay was due to water entering the coffee puck rather than to grind-dependent hydraulic resistance.
This supports the principal observation that, during relatively slow preinfusion, the pressure-rise delay caused by puck saturation is only weakly affected by grind size.

5.4. Effect of basket size
With the same 18 g dose and EK1.8 grind, changing from a VST 20 g basket to the taller VST 22 g basket increased headspace. The measured additional pressure-rise delay increased from about 5.0 to 7.5 s, while maximum extraction pressure decreased. Despite the different pressure curves, both examples reported an extraction yield of 19.9%.

5.5. Effect of different shower screens
With a 15 g dose in the same basket, changing from the IMS CI 200 to SI 200 screen had little effect on headspace and therefore little effect on the pressure delay: approximately 6.0 versus 5.5 s. Extraction yields were 20.4% and 21.3%, respectively. The SI 200 produced a gentler pressure decline; the proposed explanation is its smaller distance to the puck surface, although further testing is needed to confirm this hypothesis.

In a second comparison, changing simultaneously from CI 200 + VST 15 g to SI 200 + VST 20 g, with an 18 g dose and the same EK1.8 setting, increased the time to 2 bar from 14 to 16 s. The lower maximum pressure was attributed to the combined effect of increased headspace and the larger holes of the VST 20 g basket.

5.6. Main Observation Results:


6. Conclusion
The experiments indicate that the early espresso pressure curve can largely be interpreted as the compression of a trapped air volume by the net accumulation of water above the puck. Headspace and pump flow determine how rapidly this compression occurs, while water entering the coffee delays it. Basket geometry therefore affects pressure indirectly through its effect on headspace.
1. How does initial headspace influence pressure build-up?
2. How does pump water-flow rate influence the pressure curve?
3. How do puck penetration and grind size influence the initial delay?
4. How do basket size and shower-screen configuration affect the pressure profile?
Radial uniformity of espresso extractions
1. Introduction
Stéphane Ribes's March 2020 presentation, Radial Uniformity of Espresso Extractions, investigates whether coffee is extracted evenly across the radius of an espresso puck. Instead of treating the extraction yield of the finished beverage as a complete description of the shot, the presentation separates the spent puck into concentric regions and measures the extraction yield of its centre, middle and outer portions.
This distinction matters because a satisfactory average extraction yield can conceal substantial internal variation. A highly extracted centre can compensate numerically for a severely underextracted perimeter. The presentation therefore focuses on both:
Two practical interventions are compared: placing a V60 paper filter below the puck and changing the tamper from a flat base to a convex “US curve” base. The presentation then proposes a basket-design explanation for the remaining edge deficit.
The central finding is that, under the tested conditions, the perimeter of a conventional espresso puck is much less extracted than its centre. A paper filter below the puck substantially reduces this radial difference, whereas a convex tamper base makes it worse.
2. Questions asked
Stéphane attempted to investigate and answer the following questions:
3. Method
Experimental principle
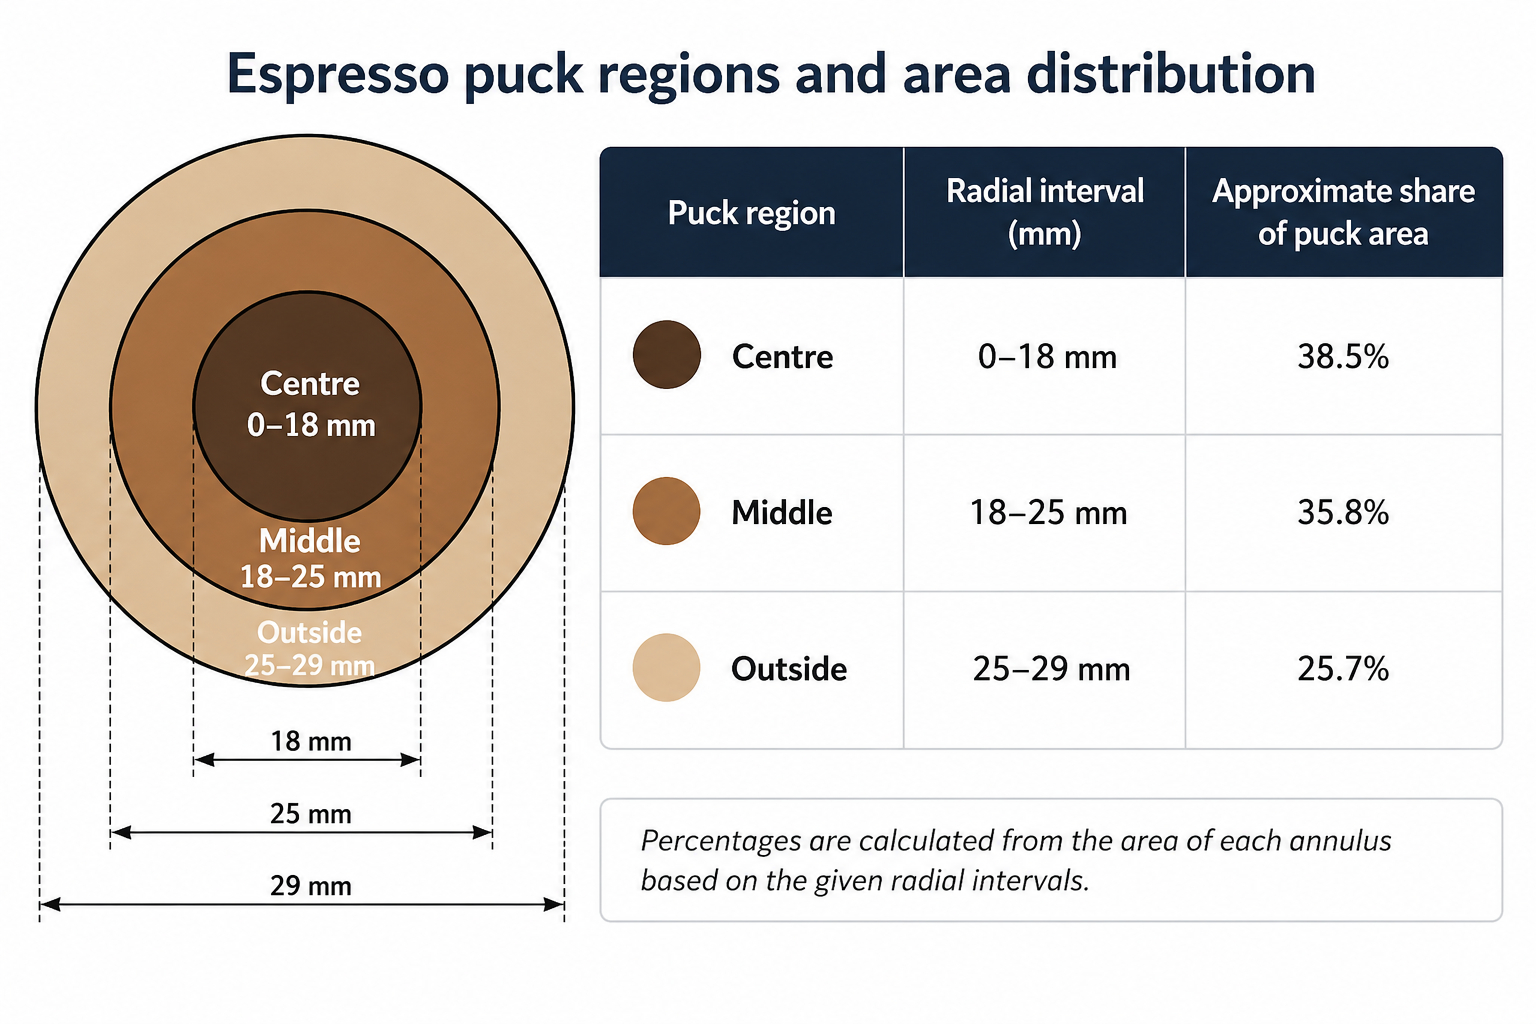
The test protocol proceeds along two analytical paths. First, the espresso beverage is collected and its overall extraction yield is determined. Second, the puck is divided into three concentric portions: outside, middle and centre. The EY of the three puck fractions is then also determined.
The radial graphs identify the boundaries of the three regions as follows:
Equipment and controlled conditions
For the filter and tamper comparisons, the dose, basket, grind setting and 1:2.5 ratio were held constant. This makes the comparisons meaningful at one common grind resistance, although it does not show how each configuration would perform if individually re-dialed to its own optimum.
Extraction profile
The presentation supplies a hybrid “lever-blooming” profile described as a combination of Londinium and blooming profiles. Its principal extraction flow is 2.5 mL/s. Here's the profile steps:
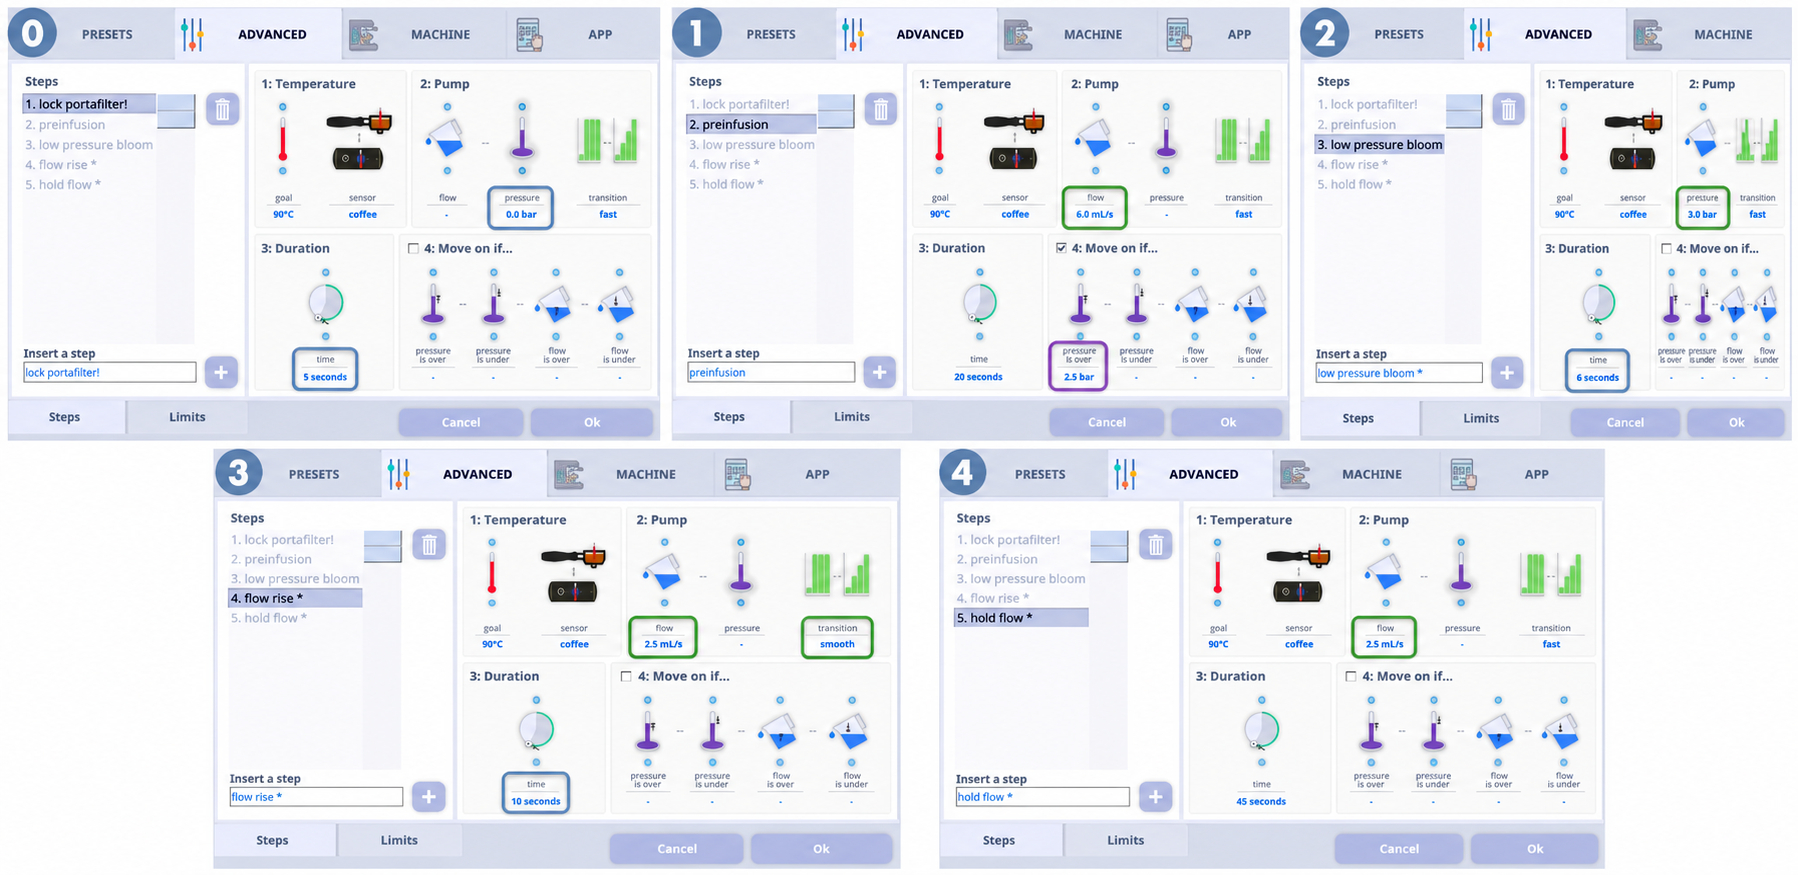
The initial “lock portafilter” step is optional. Its purpose is to keep the puck from being exposed to the hot machine environment while the brew water completes its final warm-up.
4. Results
Thanks to his experiments, Stéphane found the following EY:
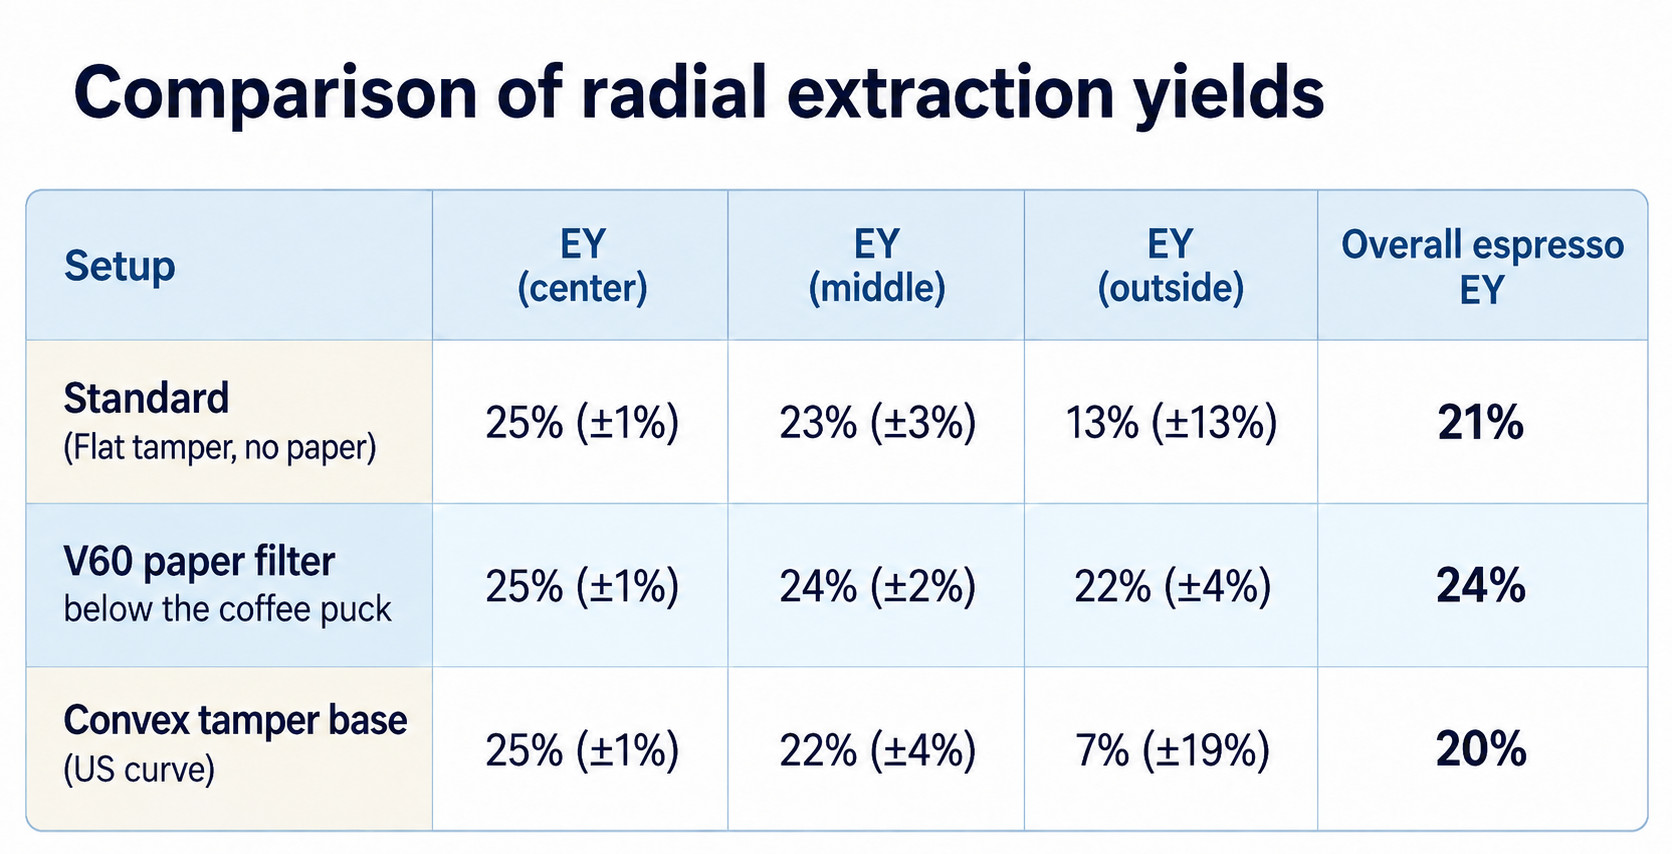
To sum it all up, Stéphane found the following:
5. Conclusion
The presentation's evidence points to a specific structural weakness in conventional espresso extraction: the outer part of the puck receives substantially less effective extraction than the centre. This is not a minor border effect, because the affected outside annulus represents approximately one quarter of the dose.
The V60 paper filter below the puck is the most successful tested intervention. It leaves the centre essentially unchanged while raising the outer-region extraction from 13% to 22%, reducing the radial spread by three quarters and increasing overall extraction from 21% to 24%. In contrast, the convex tamper intensifies central preference and reduces outer extraction to only 7%.
The basket-perforation analysis provides a coherent engineering explanation, but it remains a proposal requiring a direct experiment.
1: In a standard espresso shot without a paper filter below the puck, how uniform is extraction yield from the centre to the edge?
2: Does placing a V60 paper filter below the puck improve radial extraction uniformity and increase the average extraction yield?
3: How does a convex “US curve” tamper base affect radial extraction compared with a flat tamper base?
4: Could the limited perforated area of an espresso basket explain peripheral underextraction, and would enlarging that area be a promising solution?
The 4 mothers: a unified theory of espresso making recipes
The optimal espresso curve
I've been working on a "unified theory of espresso making recipes", which results in 4 "mother" recipes.
But before I plunge into that, I want to make the argument that there is an arguably optimal pressure curve for espresso recipes.
You can see it as the pressure profile that occurs naturally when constant flow water is used to make an Allongé recipe coffee on the Decent. The resulting pressure is a reflection of the declining puck resistance over time, as the puck loses material to the espresso drink.
 This curve has the following characteristics:
I think it's no coincidence that this is exactly the pressure curve that most spring lever espresso machines naturally give you. The people who designed their machines, very likely did this on purpose, by using their eyes and taste buds, as they didn't have access to the data we now have.
I'm going to argue that the "best" espresso recipes are all variations on the curve above, as they recognize the reality of the physics of the coffee puck during espresso extraction.
For me, "best" = "tastes most pleasing" = "most good flavors, minimizing bad flavors". I realize that people have different levels of acidity they seek, and I'm deliberately putting that aside here, focussing instead on flavors.
The "four mother" recipes
My position is: a bean's roast level is the most important consideration in choosing a recipe for making espresso.
This is because, the darker a coffee bean is roasted:
Put another way: the less soluble a bean is, the more your recipe will have to work harder to get material out of the bean.
The three main ways to get more material out of a bean are:
Finer grind size also increases extraction, but is not an independent variable. There is typically an appropriate grind size for each type of recipe.
This gives us:

Which gives us these insights:
Roast Levels
My definition of roast levels is flavor based, which isn't necessarily that common an approach but here is how I think of them:
This article is a work in progress, and represents my current thinking. I very much would like to discuss it and you're welcome to revise my chart above with your ideas.
Puck preparation
The Hog puck preparation tool
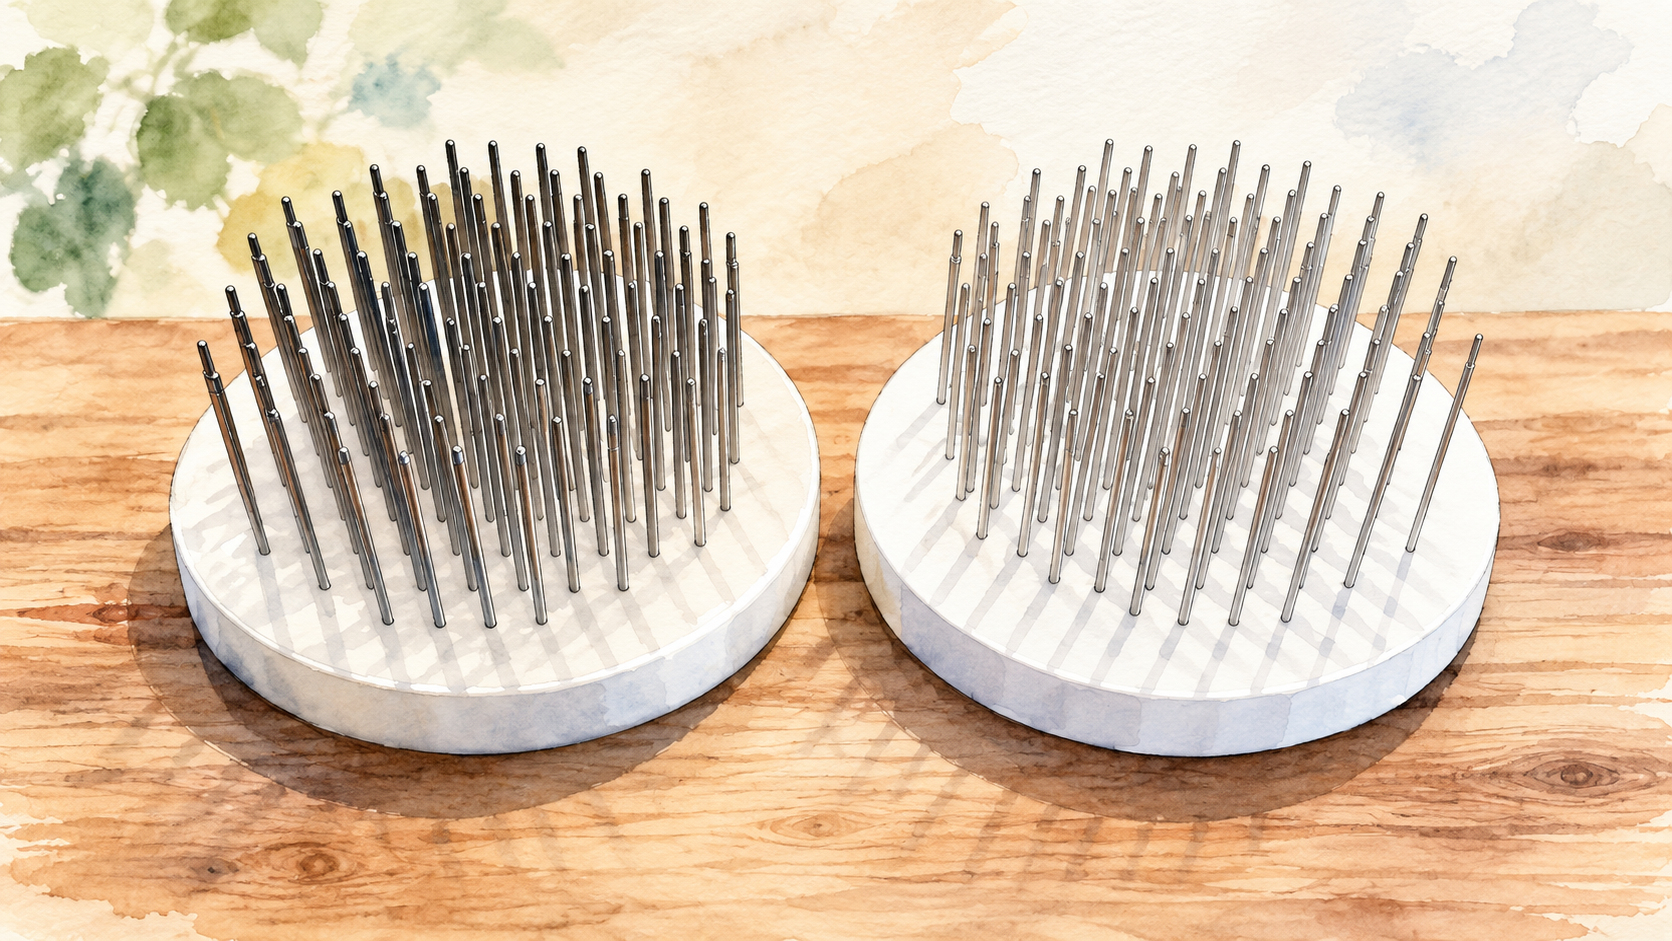
The following article is based on a presentation by Stéphane Ribes from June 2019. It's based on research with the so-called Hog puck preparation tool. In fact, this study evaluates how the Hog tool impacts extraction dynamics, flow profiles, temperature and concentration gradients, and taste across different extraction profiles.
What is the Hog?
Introduced conceptually by Matt Perger of Barista Hustle in 2017, "The Hog" is a specialized puck preparation tool designed to introduce "controlled channeling" by poking vertical canals into the compressed coffee puck prior to tamping. So it's not a WDT distributor tool like we know it today. Rather, it's actively used to poke holes into the coffee puck and, thus, control the channeling.
The 2 hog tools tested were inspired by this work; they were designed and manufactured by Joachim Morceau (and his wife), French barista – formerly head Barista at Terres de Café and now owner of the Substance café specialty coffee place in Paris.
- Designed for VST 20g+ baskets

A similar, now available tool, is the PorcuPress by Sworksdesign.
Benefits
Additional information
Questions asked
Tools used
Method / proceeding
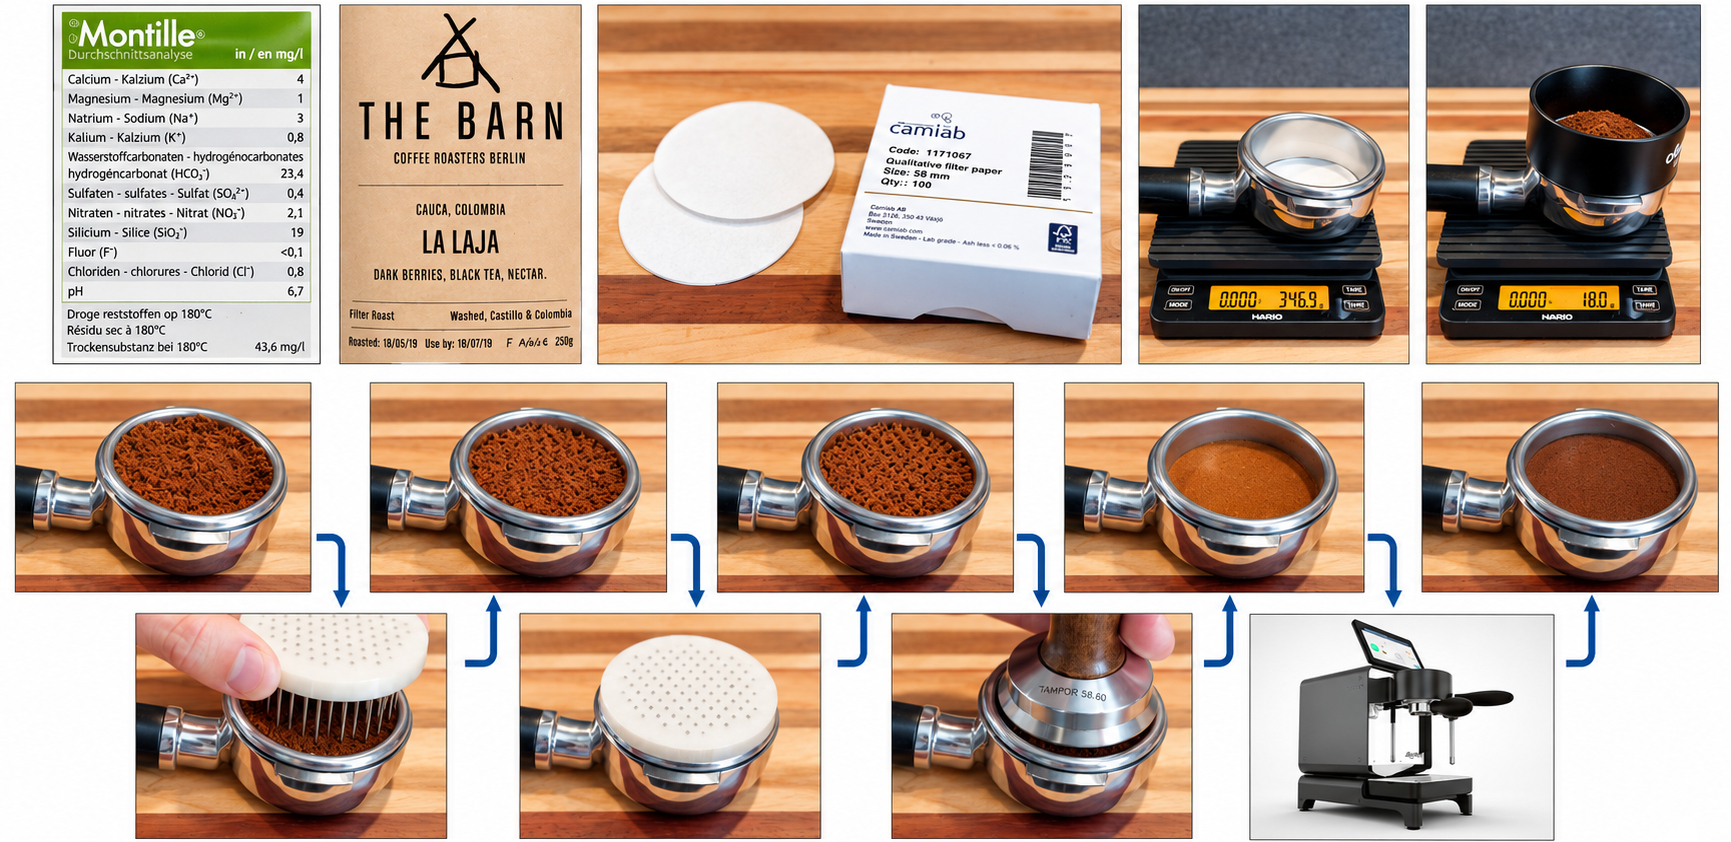
Observed impact of the Hog on extraction
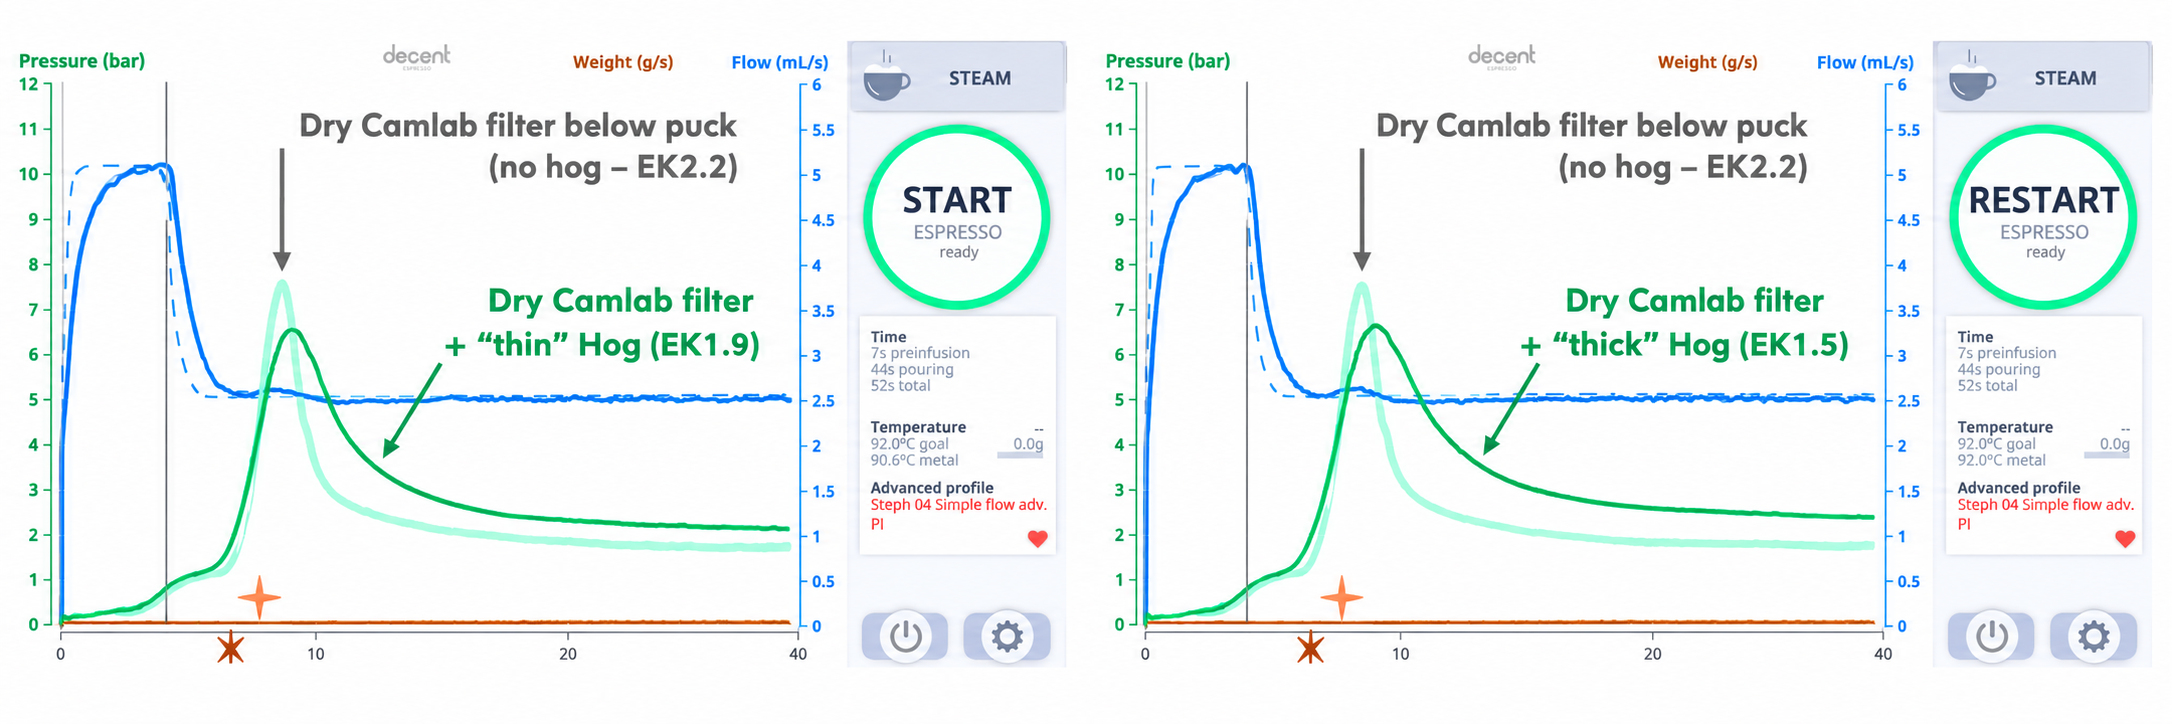
Effects of the hog tool on pressure evolution during espresso extraction (flow profile)
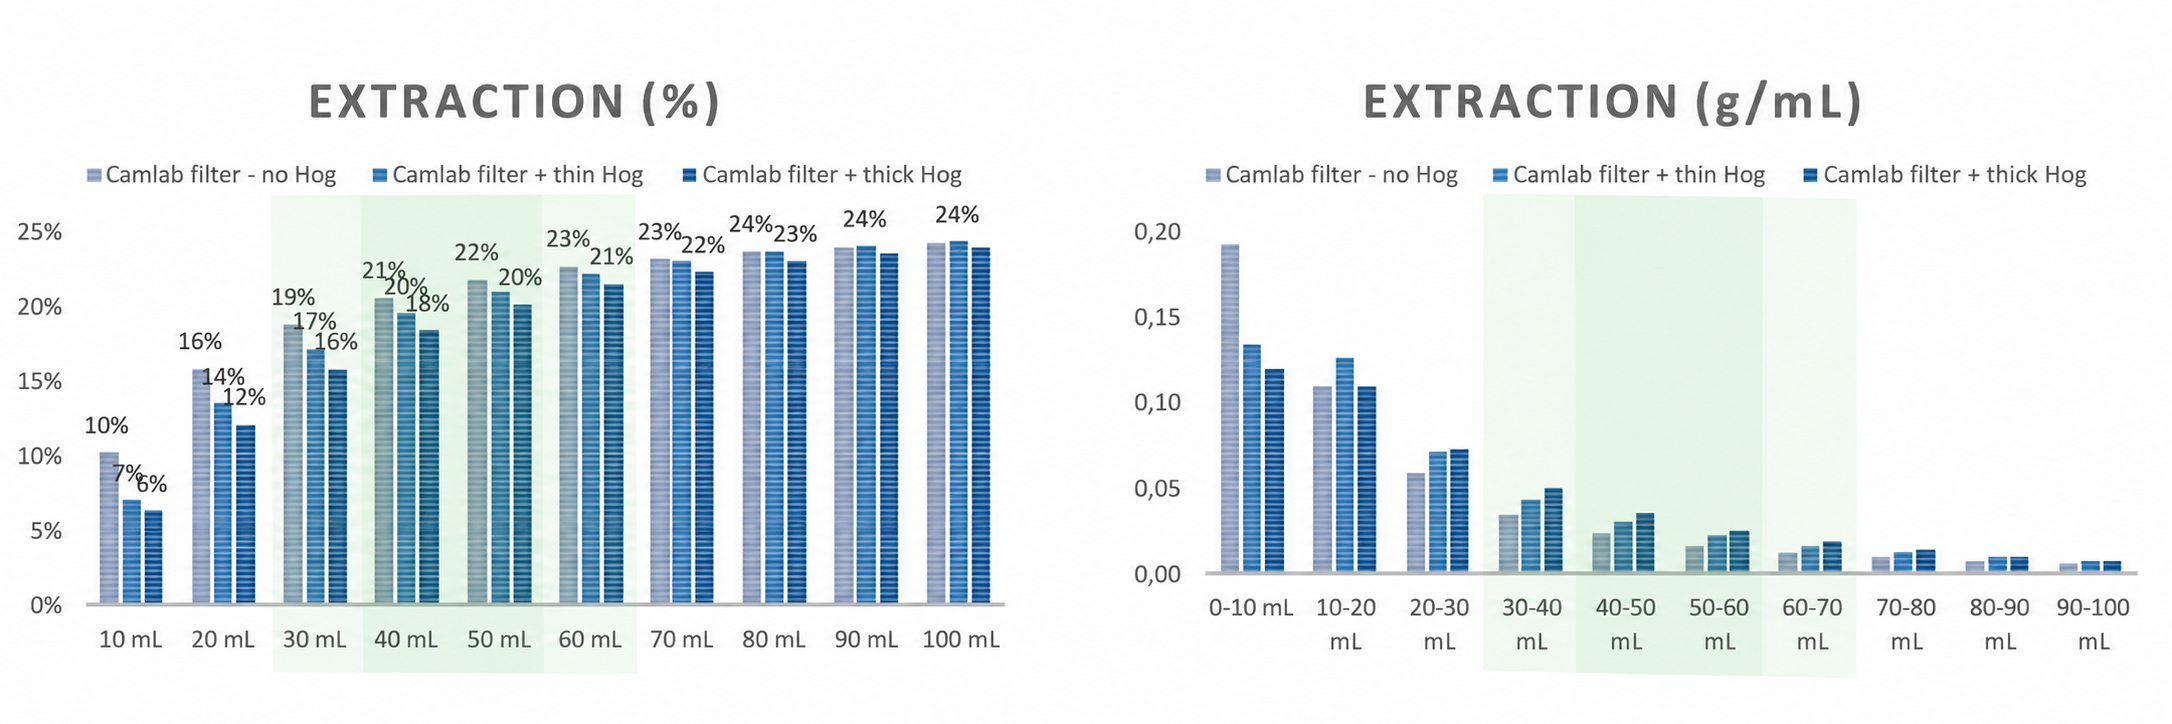
Effects of the hog tools on extraction evolution
The Hog: Straight 9 bar extraction experiment without paper filter
Tested configurations
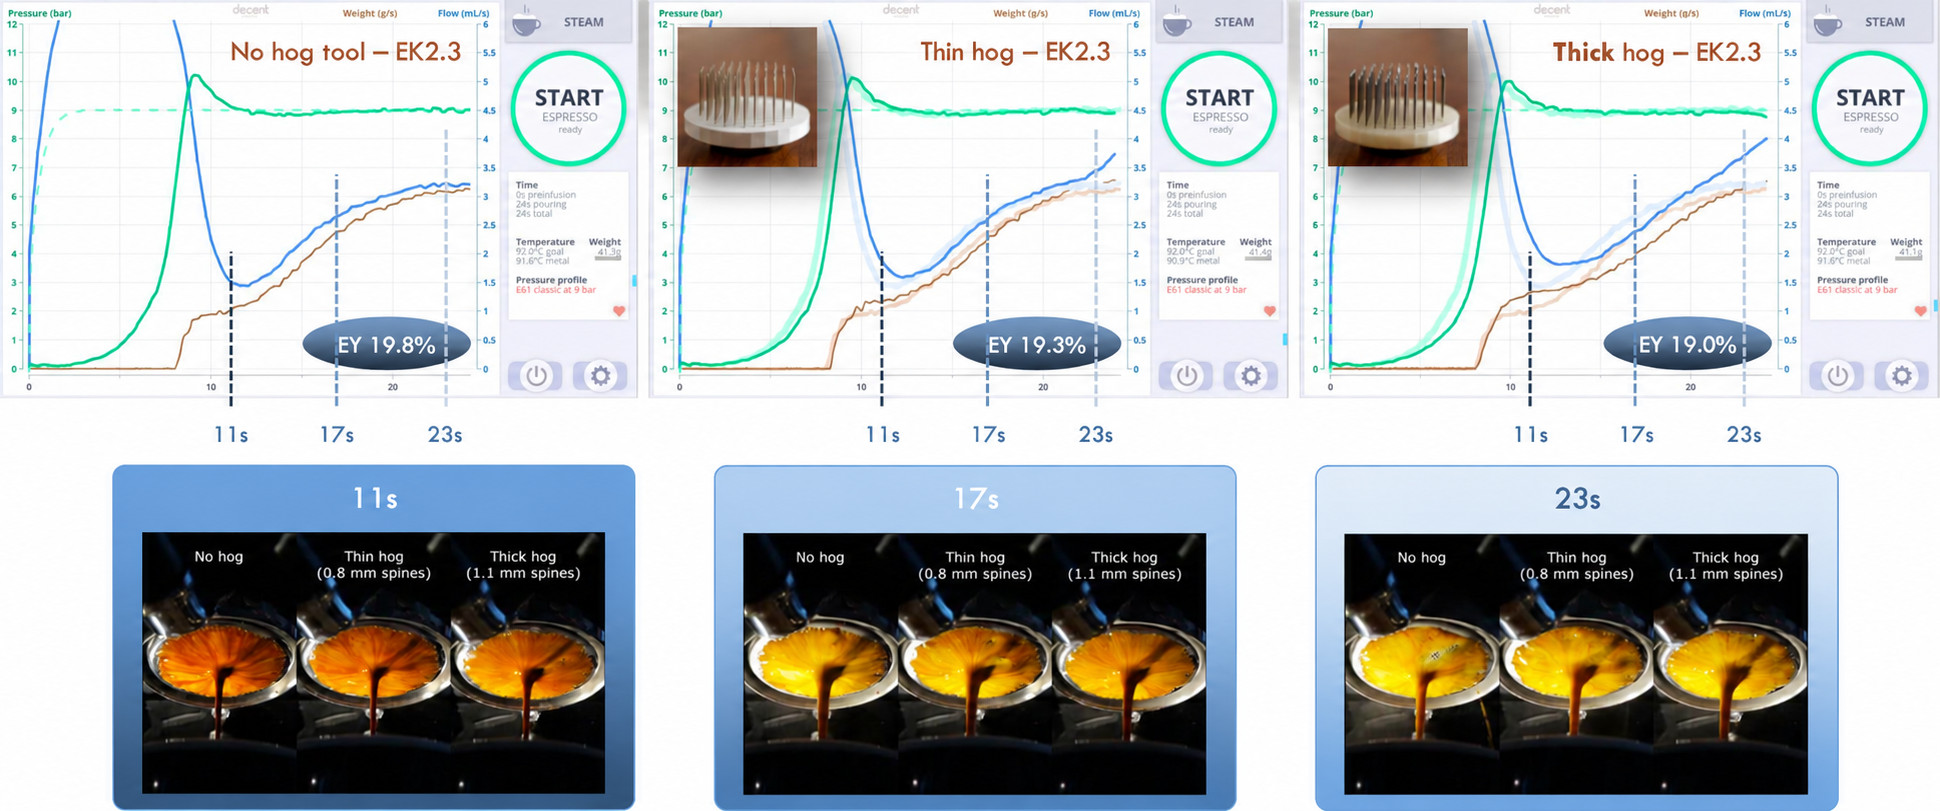
Observation and measurement results
Taste Results

The Hog: Advanced preinfusion and 9 bar extraction experiment without paper filter
Tested configurations
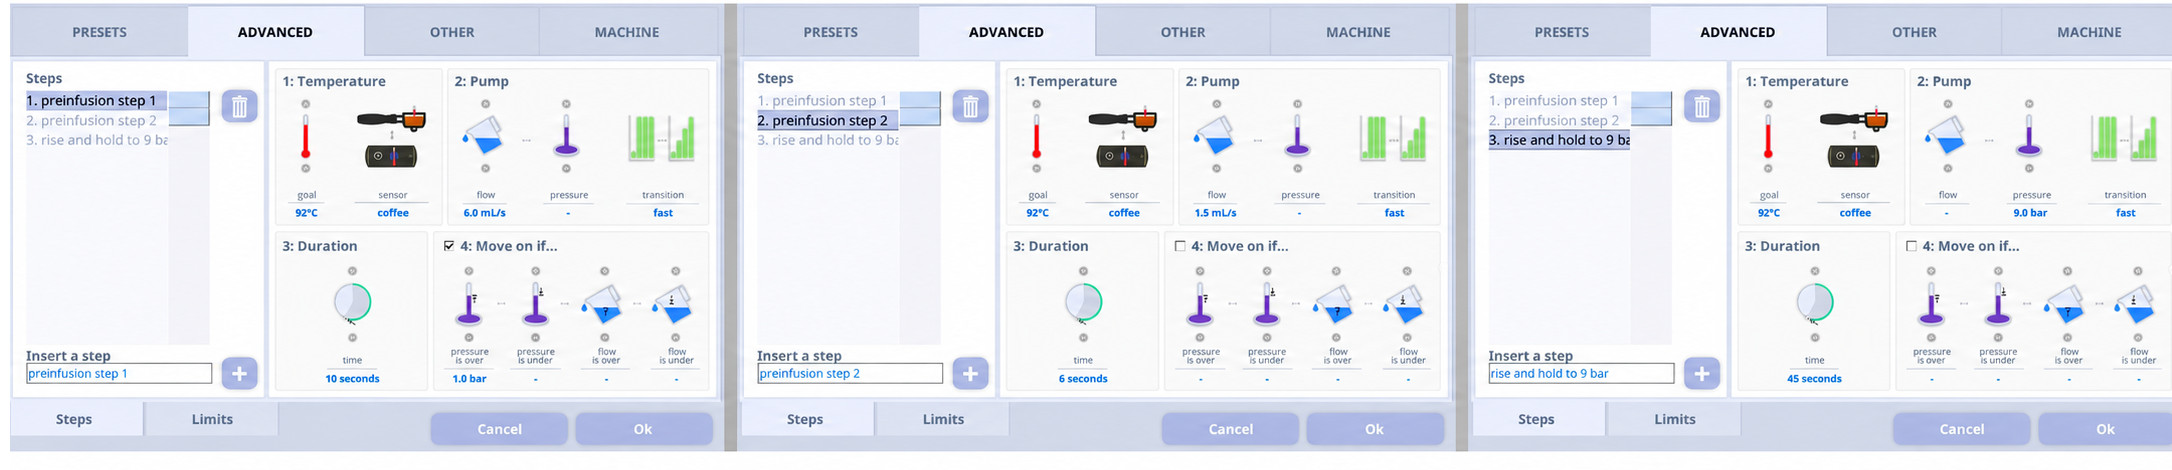
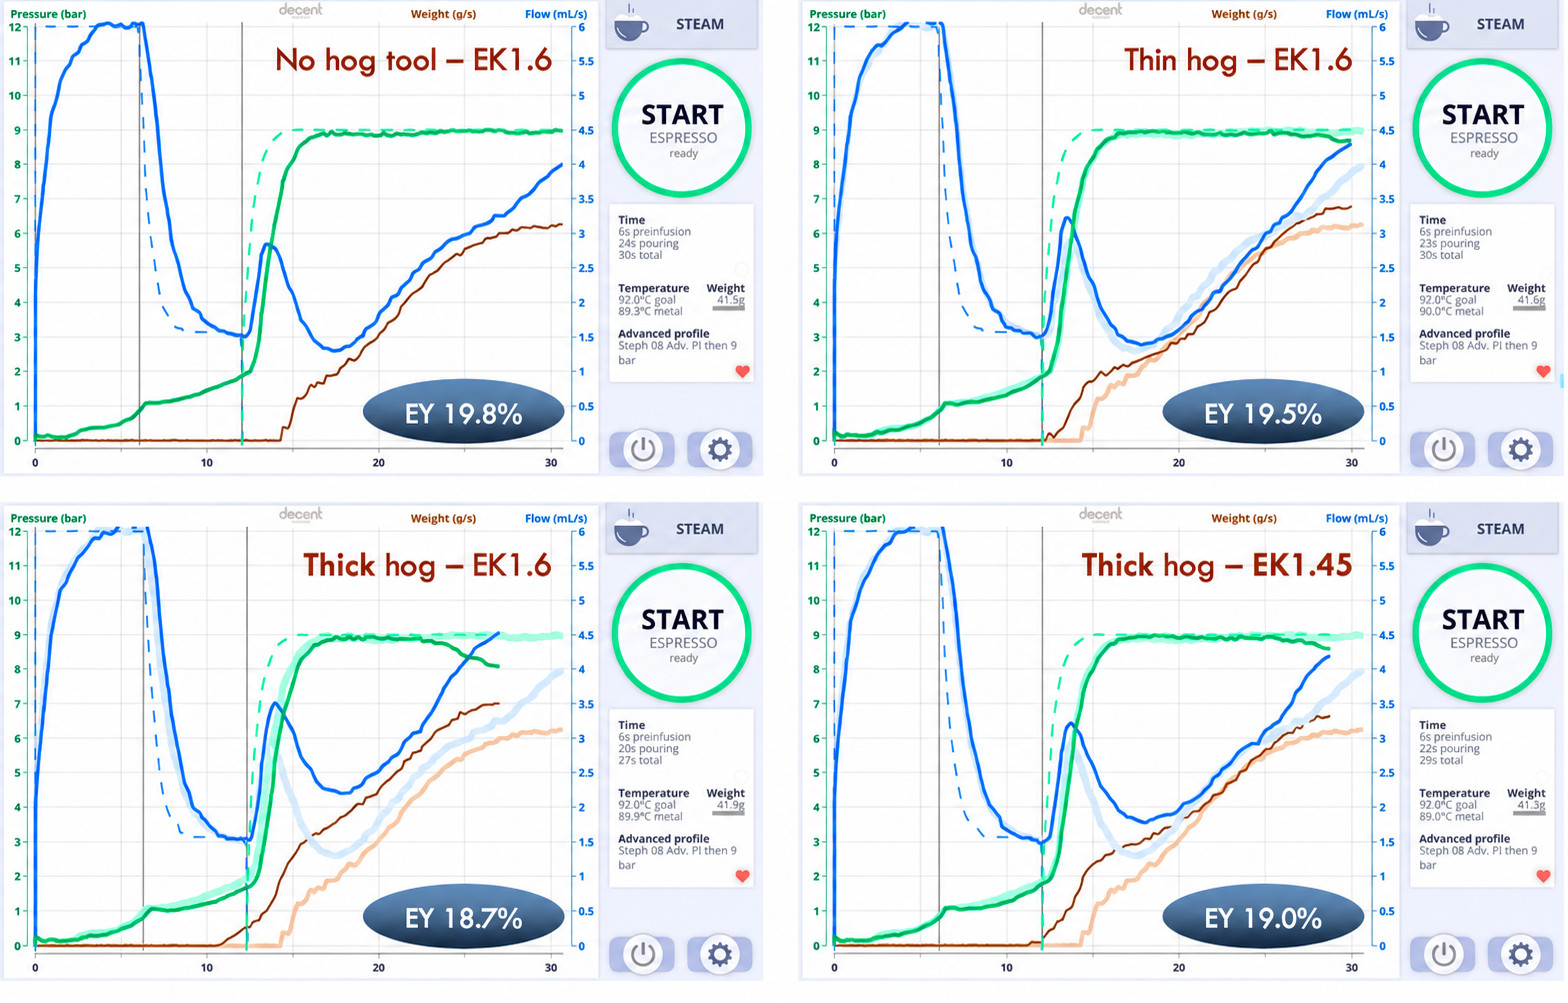
Observations
Also...
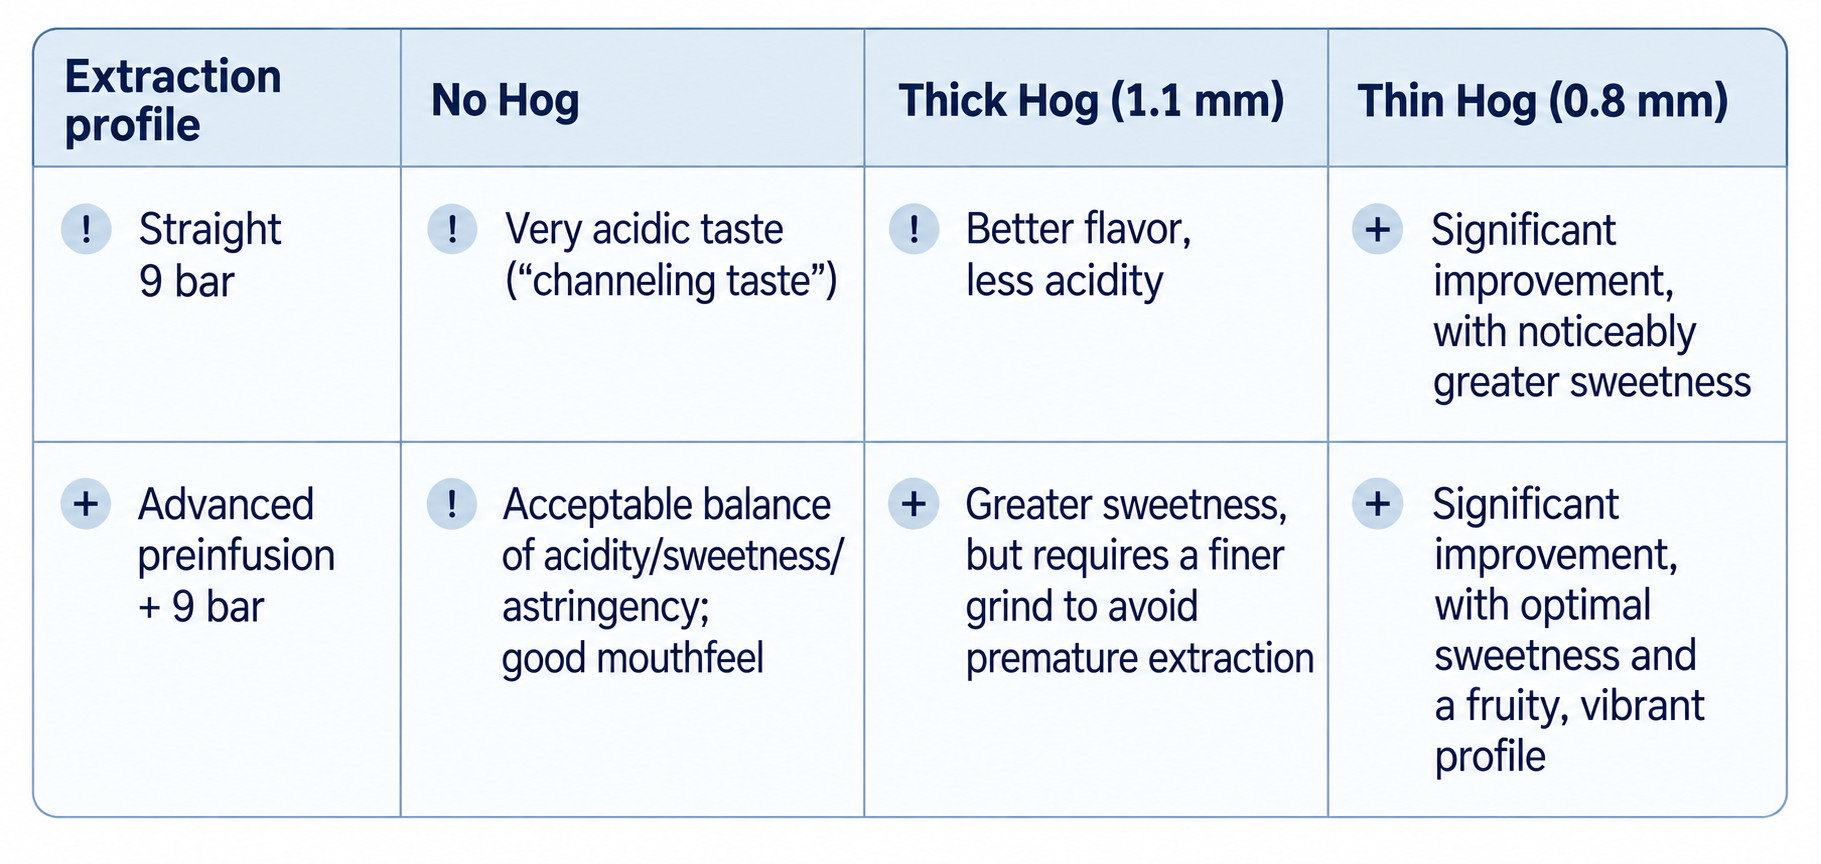
Taste results

Summary table comparing taste
Conclusion
Creating vertical canals in the coffee bed via the Hog preparation tool acts as a mechanism of "controlled channeling" that fundamentally changes how water interacts with the coffee puck. Based on the findings of the experiments, the questions elaborated above can be answered as follows:
1. How do vertical canals affect pressure stability, flow dynamics, and puck wetting? Creating vertical canals leads to significantly quicker, more uniform puck wetting, moving the time to first drop from 14 seconds to 12 seconds. The canals reduce edge channeling, lower the temperature and concentration gradients between top and bottom grinds, and minimize puck compression during high preinfusion flow rates. Under flow priority profiles, this reduces the rates of pressure rise and decrease, resulting in a smoother, more stable extraction pressure overall.
2. What is the impact of the Hog tool on Extraction Yield (EY) progression? Instead of a rapid initial spike in extraction, the Hog alters the EY progression to extract coffee more gradually throughout the shot. While overall final extraction yields are slightly lower compared to non-Hog prep at the same grind size, this smoother progression offers better control over extraction in standard brew ratio ranges (e.g., 2.1-2.6), preventing sharp over- or under-extraction spikes early in the shot.
3. What are the key differences between the thin-spike and thick-spike Hog designs? Both designs feature 95 steel spikes set in a 3D-printed base for 20g+ VST baskets, but differ in spike diameter: the "thin" version uses 0.8 mm spikes, while the "thick" version uses 1.1 mm spikes. The thick-spike tool exerts a much stronger effect on puck resistance, requiring a significantly finer grind setting (e.g., EK1.5 vs. EK2.2) to match peak extraction pressure. The thin-spike design offers a more moderate, balanced modulation of pressure and flow without requiring extreme grind adjustments.
4. How does the Hog tool interact with different extraction profiles?
5. How does vertical canal preparation influence the in-cup taste profile? The Hog measurably improves in-cup flavor profiles by reducing harsh channeling sourness. Across both straight 9-bar and advanced preinfusion profiles, the thin-spike Hog (0.8 mm) consistently produces the best sensory results, significantly enhancing sweetness, clarity, and fruity acidity compared to standard preparation.
Effects of using frozen beans on coffee

Stéphane Ribes explored the impact of freezing coffee beans on espresso extraction consistency, water flow resistance, and optimal resting time post-roast. This article is based on his presentation from July 2019.
Main questions asked
Method used & proceeding
Stéphane conducted controlled experiments measuring extraction yield (EY), extraction pressure profiles, and flavor characteristics across different coffee roasts and resting timelines.
Equipment & preparation details
Testing procedure

Compared back-to-back shots on the same day using non-frozen vs. frozen natural Kenyan coffee (Terres de Café - Chania Estate) at identical grind settings.


Results
Conclusion
The following conclusions can be drawn from the experiments, answering the questions:
1: Does grinding frozen coffee beans lead to more consistent extractions?
Yes. Grinding frozen beans produces highly repeatable extraction pressures and steady Extraction Yields across days without changing grinder settings. This significantly reduces the need to constantly dial in coffee once an optimal recipe is set.
2.: How does freezing affect water flow resistance during grinding and brewing?
Frozen coffee beans offer greater resistance to water flow when ground. Because frozen beans yield higher puck resistance, a coarser grind setting can be used to reach a target extraction pressure, helping bypass grinder performance limitations associated with ultra-fine grind settings.
3.: Does resting coffee beans longer before freezing improve taste and extraction?
Yes. Allowing beans to rest for roughly two weeks post-roast before freezing lowers the extraction pressure peak, boosts extraction yield, and yields superior flavor profiles marked by sweeter notes and pleasant acidity.
Effects of a rippled tamper base on espresso extraction
Introduction
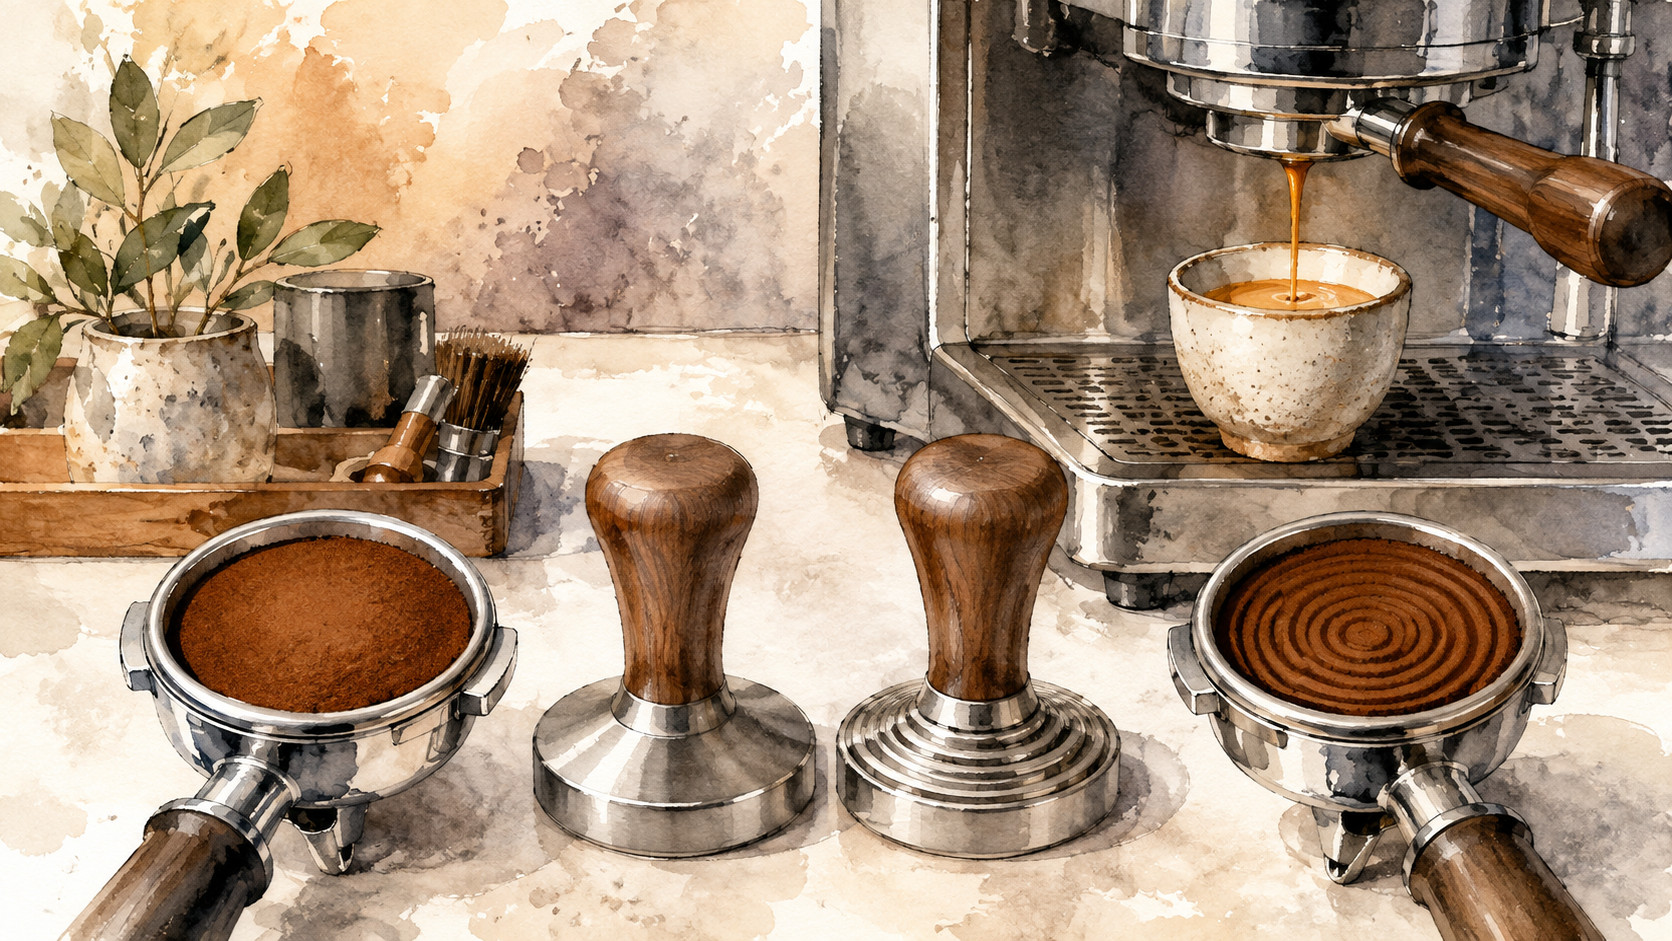
This study from November 2019 by Stéphane Ribes evaluates the performance and extraction characteristics of a rippled tamper base compared to a standard flat tamper base in espresso preparation. Using high-precision espresso equipment, the investigation assesses how tamping geometry influences extraction parameters, flow dynamics, and sensory qualities.
Research Questions
Methodology
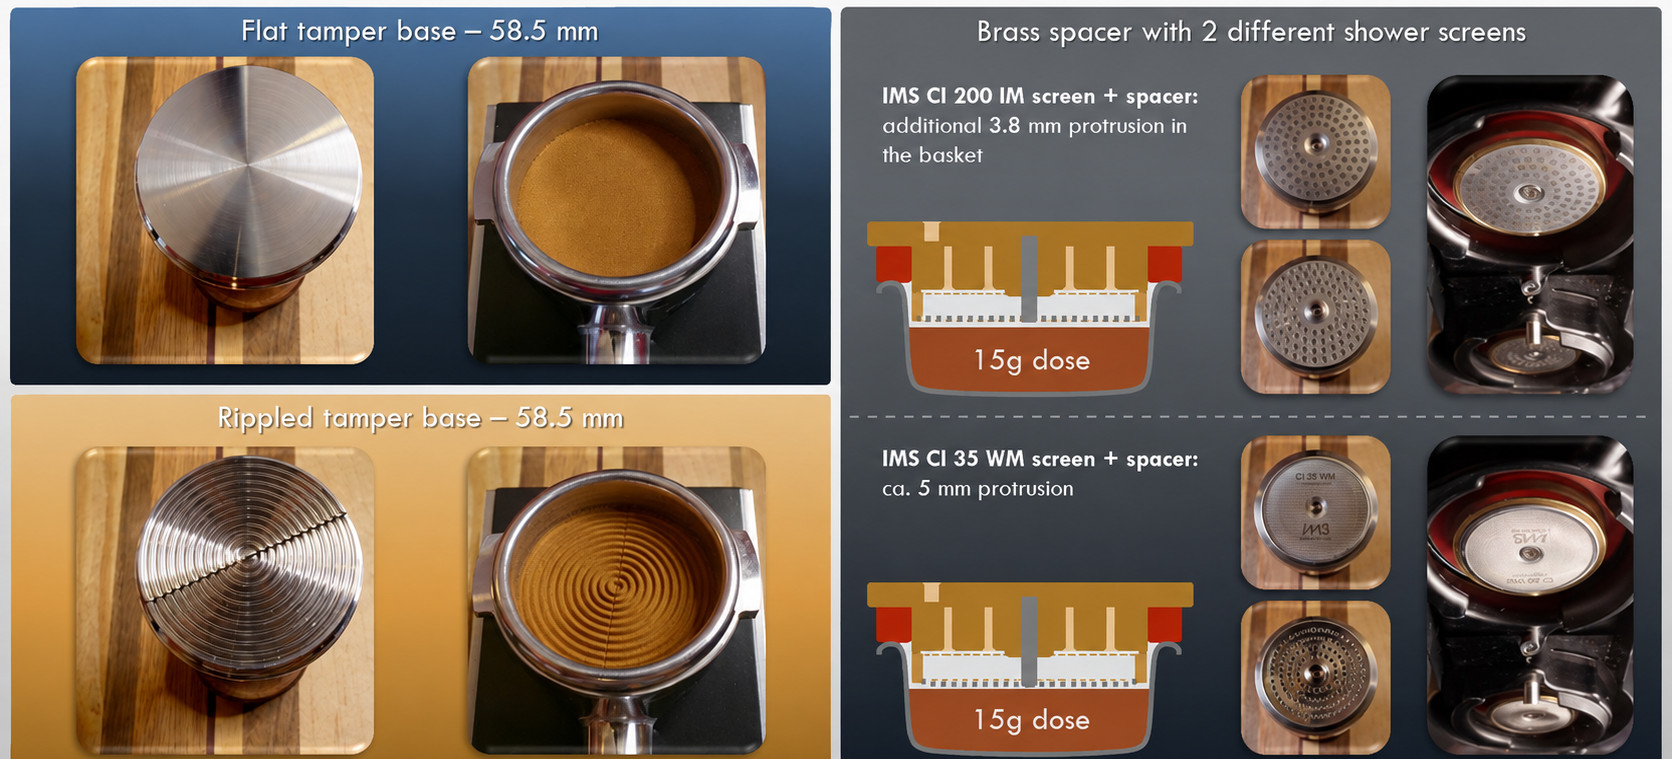
Proceeding
Results
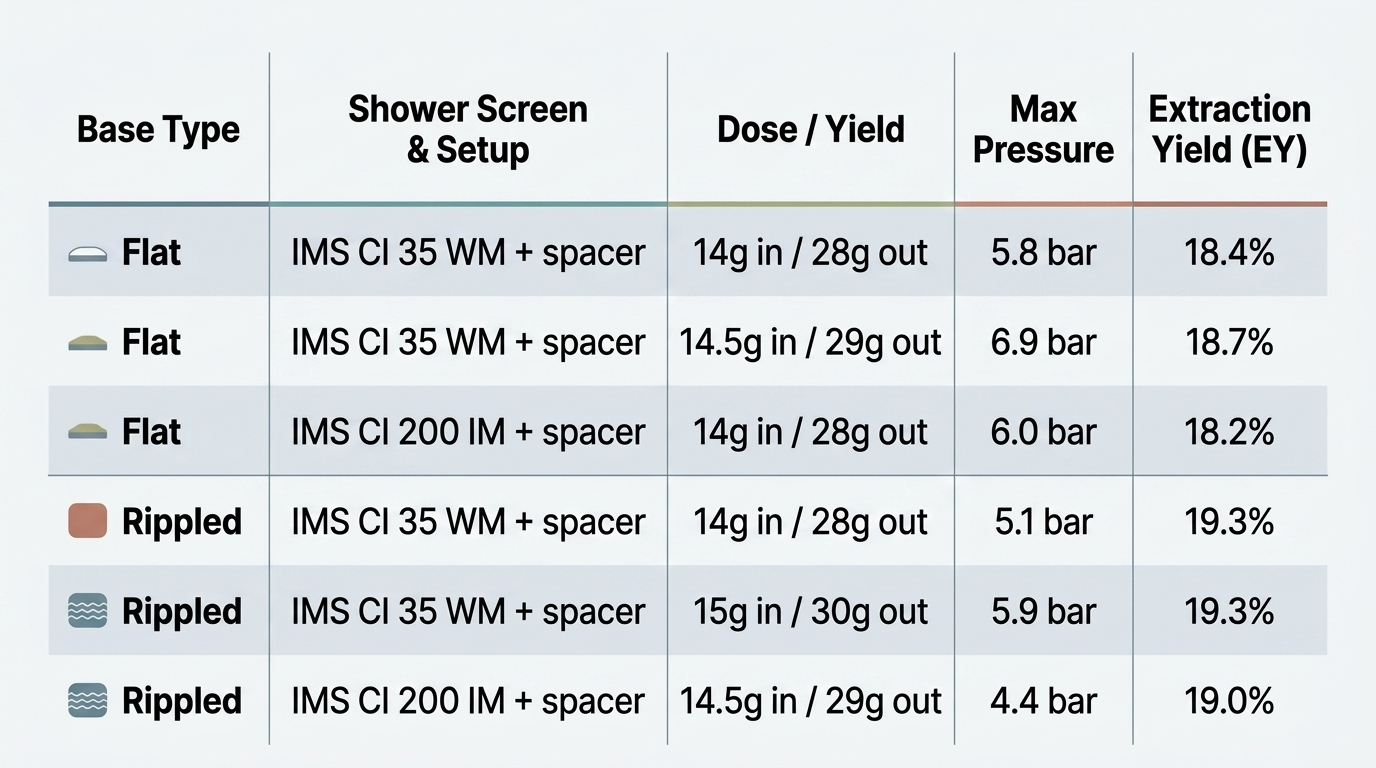
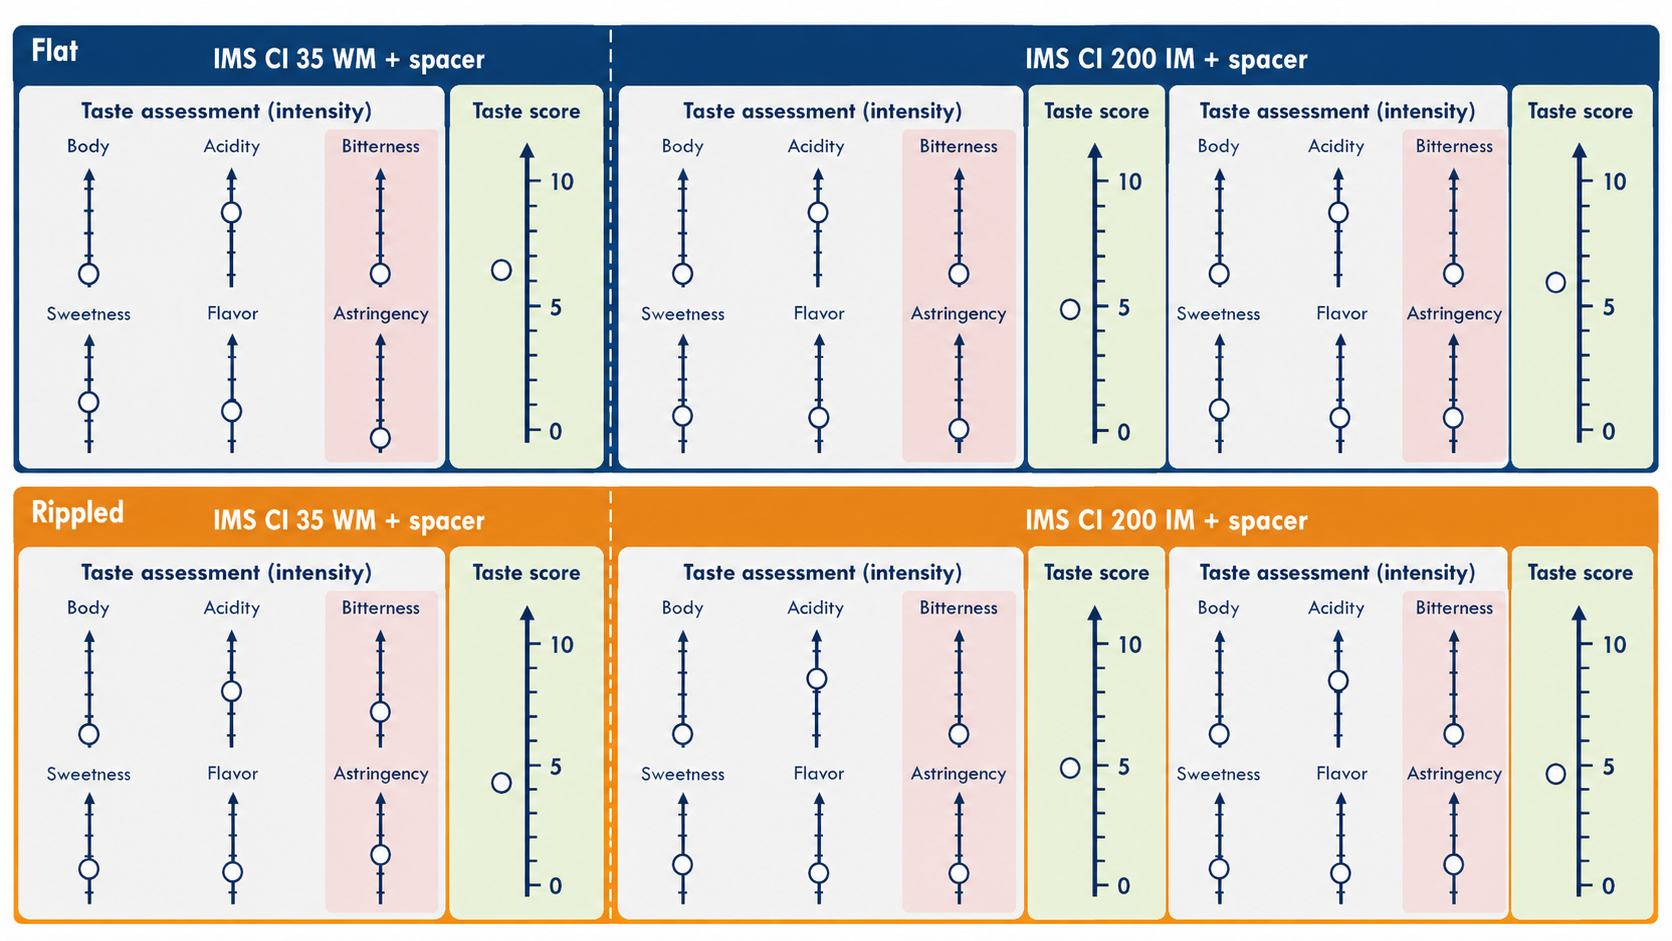
To be more precise, the sensory testing of the coffee made with the flat vs the rippled tamper base revealed the following results:
Taste assessment & profile
Overall taste score
In summary, despite yielding slightly higher extraction yields, the rippled base resulted in less favorable espresso shots due to increased astringency and muted acidity, leading to lower overall taste scores (see illustration below).
Conclusion
To conclude, here's what was found in this research, answering the questions brought up above:
What spraying your puck does to coffee
Introduction
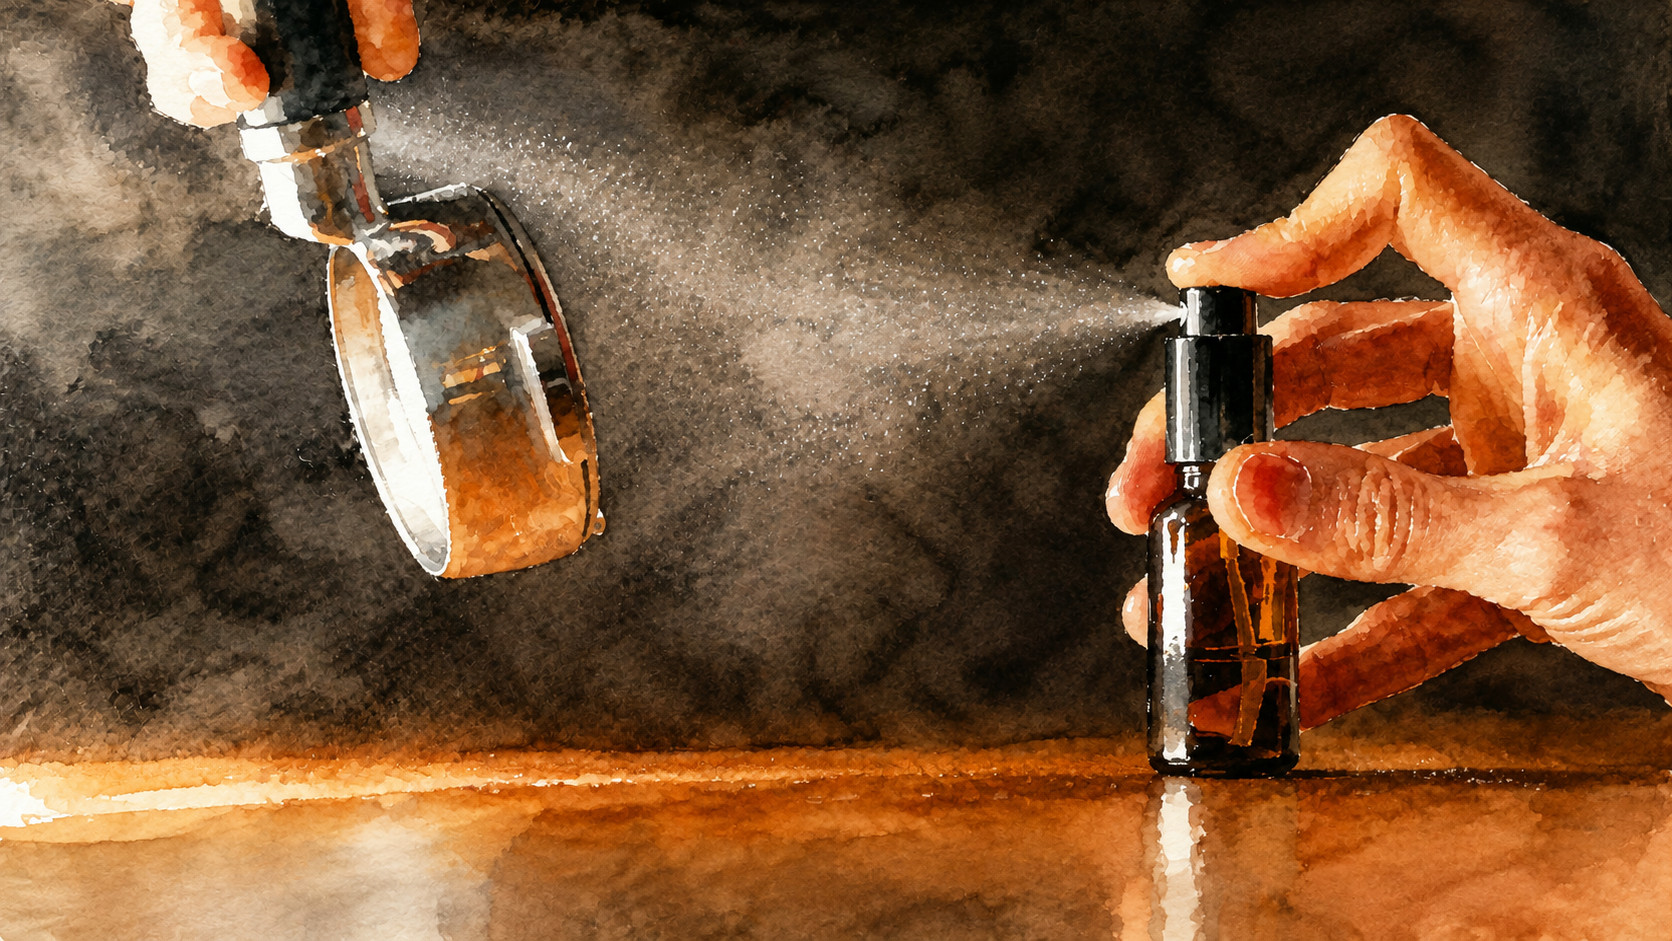
In an effort to better understand espresso extraction dynamics—particularly regarding top-puck water distribution and pre-infusion behavior—this experiment by Stéphane Ribes explores the impact of spraying water directly onto the surface of an already-tamped coffee puck prior to loading the portafilter. Inspired by discussions surrounding top paper filters, spacers, and shower screen distribution, this test evaluates how pre-wetting the top grinds influences puck resistance, flow mechanics, extraction yield, and final shot characteristics.
Main questions asked
Methodology & proceeding
Equipment & Setup
Testing process


Results
Here's a comparison of what the chart looks like without water spray vs. 1g of water spray.


Here's a comparison of what the chart looks like at different grind sizes, namely EK1.4, EK1.5 and EK1.6.


Here's a selection of videos of 4 of the tested configurations:


Conclusion
In conclusion, we can answer the questions that were brought up as follows:
Which puck preparation technique is best?
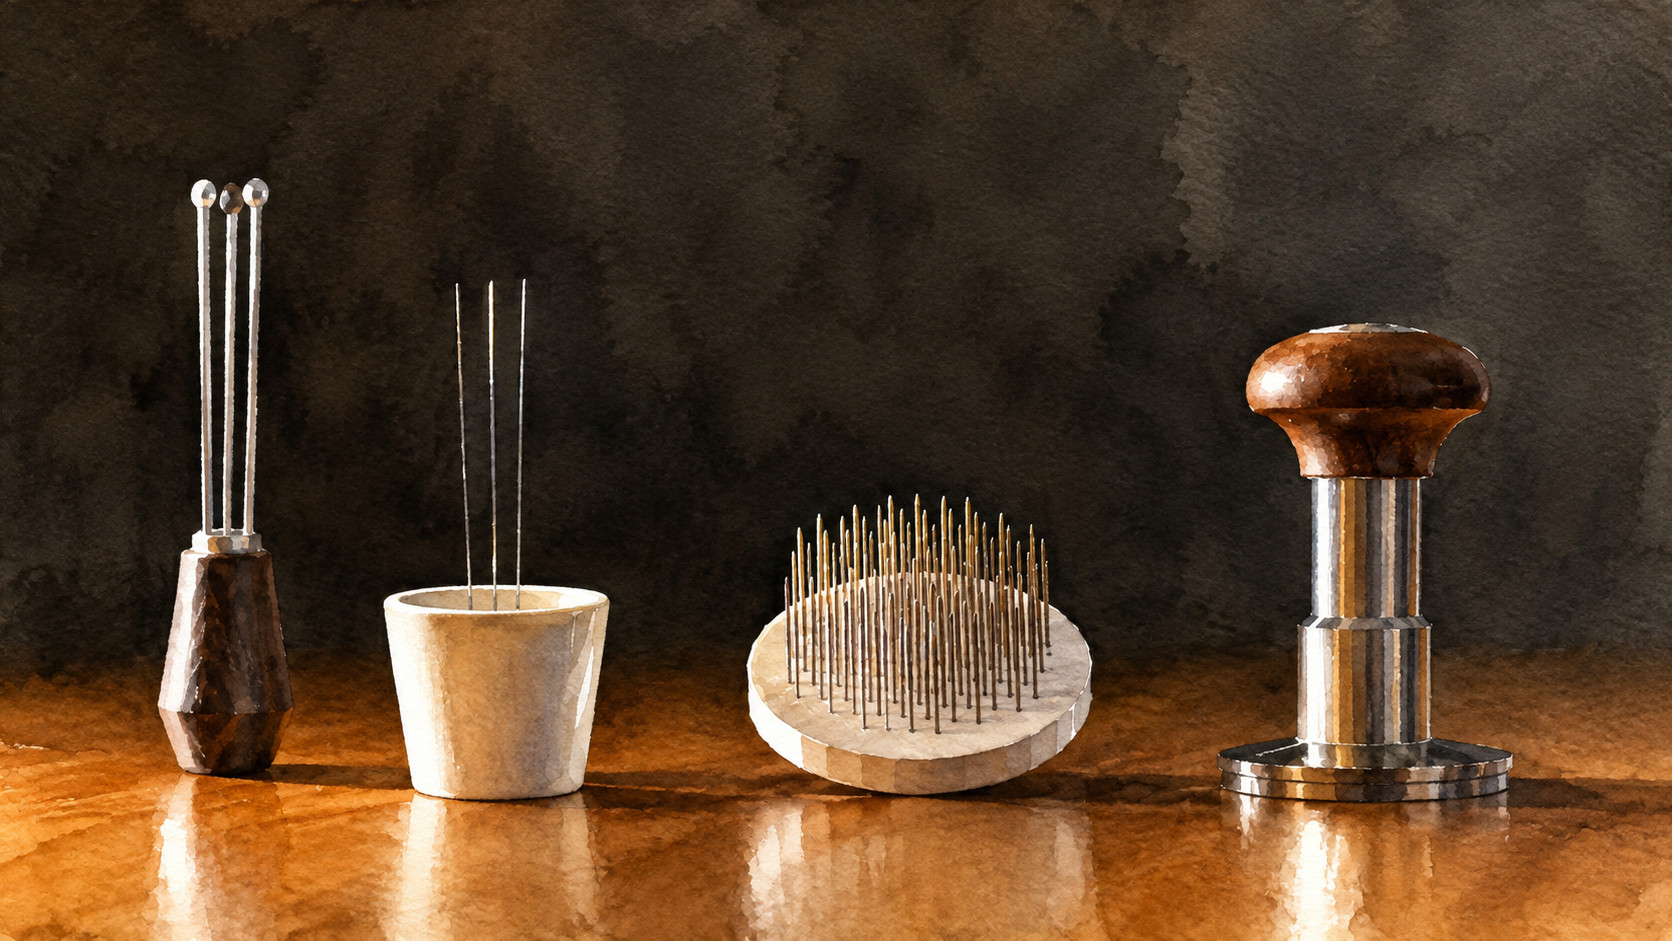
This article is based on an investigation into espresso puck preparation techniques conducted by Stéphane Ribes in June 2020 (v1.1). For reference, here's Stéphane's original PDF. Using a Decent Espresso machine (DE1PRO v1.1) and a blooming shot profile, the experiment evaluates the impact of various distribution methods, tapping, and deep-needle alignment tools (such as the Hog tool) on extraction dynamics, yield, and shot clarity/taste.
Questions
The following questions were investigated across the tests:
Method
The tests were performed following a strict standard protocol to ensure test reliability:
Proceeding The experimental runs were conducted over two main test dates:
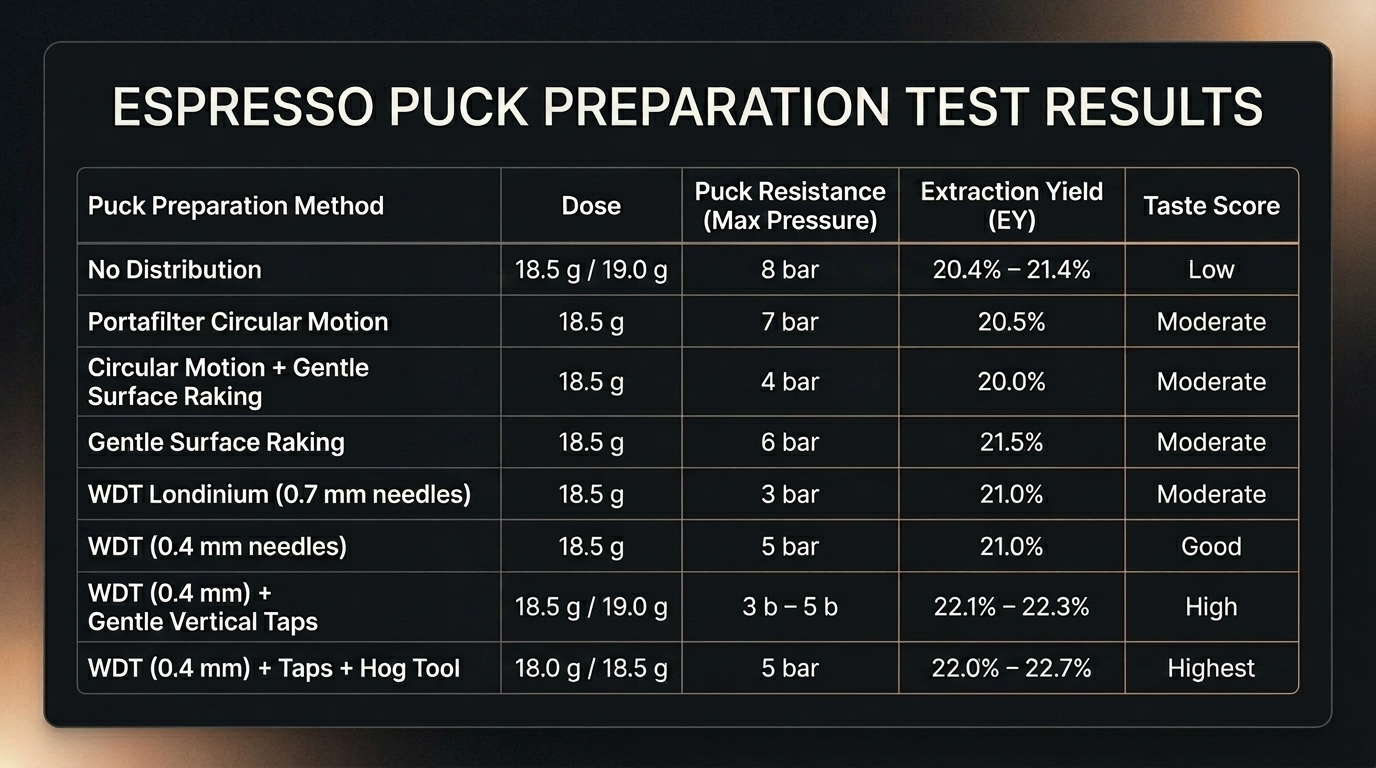
Results
The main findings and detailed metric comparisons from the tests are detailed below:
Here's a table summarizing the tests and results:
Conclusion
Based on the findings, we can answer our questions as follows:
Effects of a puck screen on extraction

The distribution of Extraction Yield (EY) across an espresso puck is rarely uniform. This study by Stéphane Ribes from April 2021 investigates radial uniformity during extraction and evaluates how placing a BPLUS contact screen (also called "puck screen") directly above the ground coffee puck alters both local extractions and the overall shot yield across VST and Pullman filter baskets.
Core research questions
This study aims to answer three key questions:
Methodology & experimental setup
To isolate the variables influencing extraction uniformity, a precise, highly controlled testing framework was established.
Measurement & data logging procedure**

Results
The data obtained through the experiments demonstrates a significant improvement in extraction uniformity and overall efficiency when applying a BPLUS contact screen across both VST and Pullman filter baskets. Below are all the Extraction Yields (EY) found:

The data shows the following:
Conclusion & key takeaways
Based on the findings, the questions can be answered as follows:
Standard espresso extractions exhibit significant radial non-uniformity. Without a contact screen, extraction at the outer perimeter of the puck (representing roughly 30% of the total dose weight) is severely underextracted, reaching only about two-thirds (approx 16%-17%) of the extraction yield measured at the center (approx 25%).
Placing a BPLUS contact screen directly above the coffee puck significantly improves radial uniformity. It lifts the outer extraction yield from 16%-17% up to 22%-23%, balancing extraction across the center, middle, and outer radial sections.
By eliminating severe underextraction at the outer edges of the puck, the BPLUS contact screen delivers a substantial increase in overall shot extraction yield for both basket types: increasing from 22% to 24% in the VST basket, and from 21% to 24% in the Pullman basket.
In conclusion, using a puck screen significantly improves radial uniformity.
Optimizing extraction profiles
Higher extraction flow rates without channeling?
1. Introduction
This article is based on research from Stéphane Ribes from February 2020. It investigates the adaptation of a hybrid "lever-blooming" profile on a Decent Espresso DE1PRO v1.1 machine. The core focus of this study is determining whether adjustments to profile steps allow for higher final extraction flow rates while maintaining the target extraction pressure range and mitigating puck channeling.
2. Questions
The investigation focuses on answering the following key questions:
3. Method
Equipment
Water & Coffee Preparation
Measurement protocol
4. Proceeding
Profile Structure (Hybrid "Lever-Blooming")

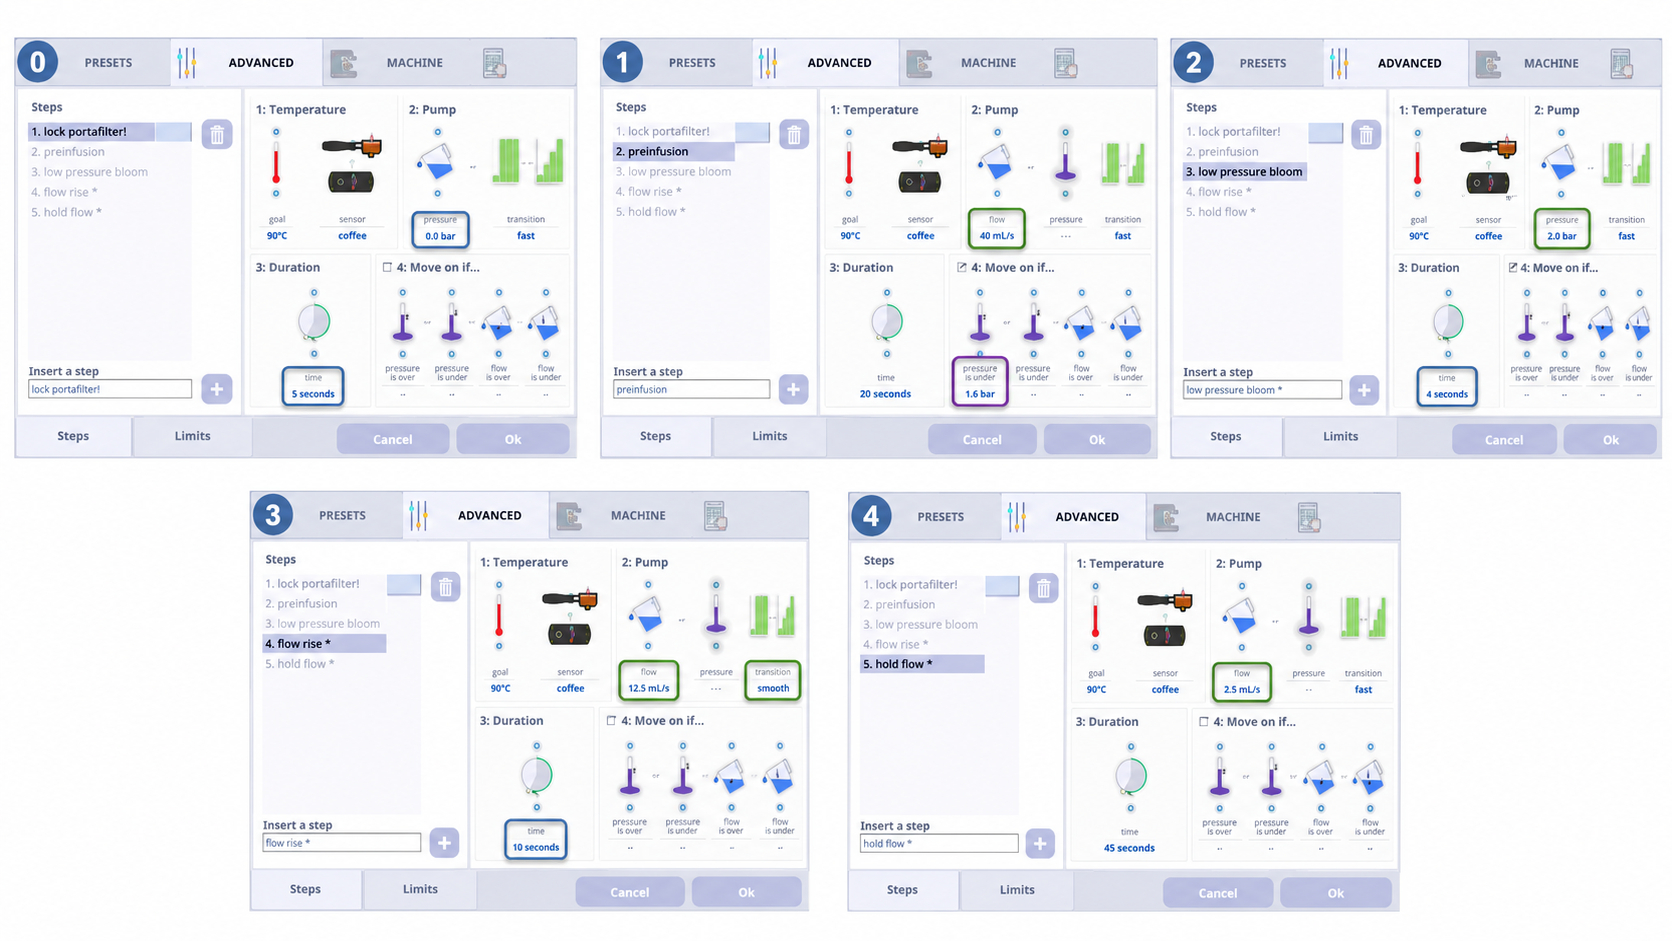
Tested profiles
5. Results
The table below outlines the measured Extraction Yield (EY) data collected across various grind size settings on the Mahlkönig EK43 S:
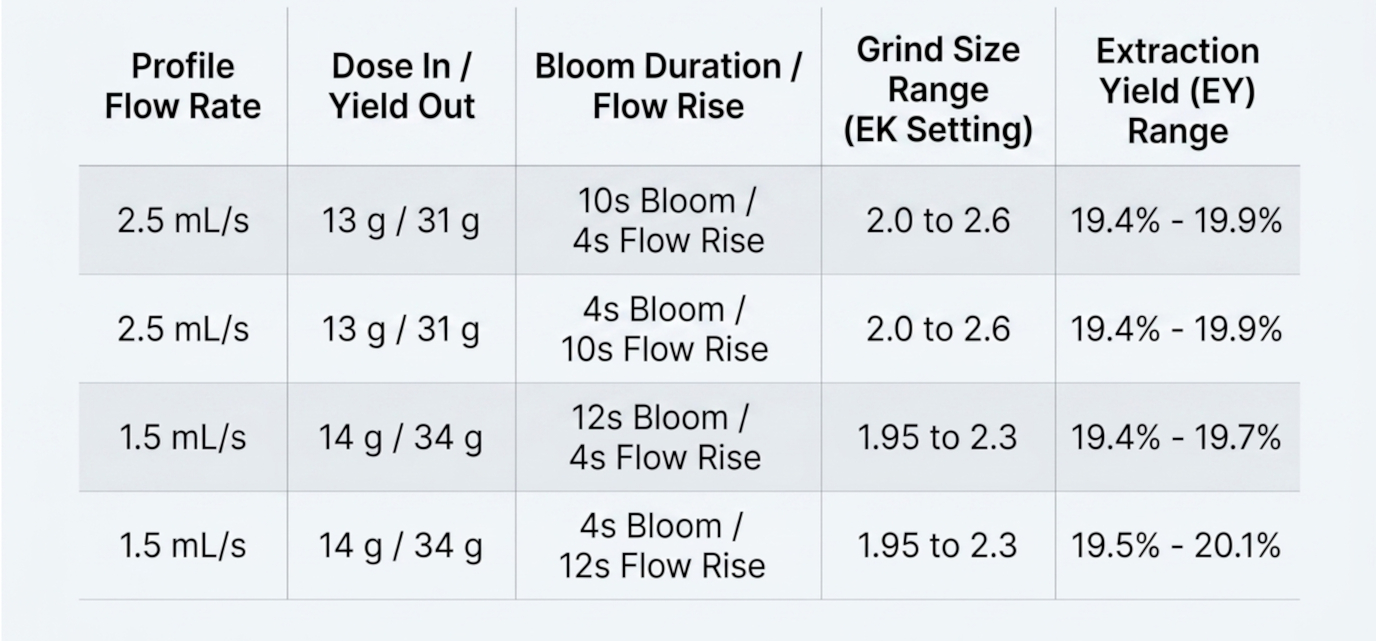
At 2.5mL/s, the experiments resulted in an identical Extraction Yield (EY) range of 19.4% – 19.9% for both bloom/flow rise variations. At 1.5mL/s, the 12s Bloom / 4s Flow Rise setup achieved an EY range of 19.4% – 19.7%, while the 4s Bloom / 12s Flow Rise setup yielded slightly higher at 19.5% – 20.1%.
6. Conclusion
The following can be concluded from the experiments:
The impact of the preinfusion flow rate on espresso extraction
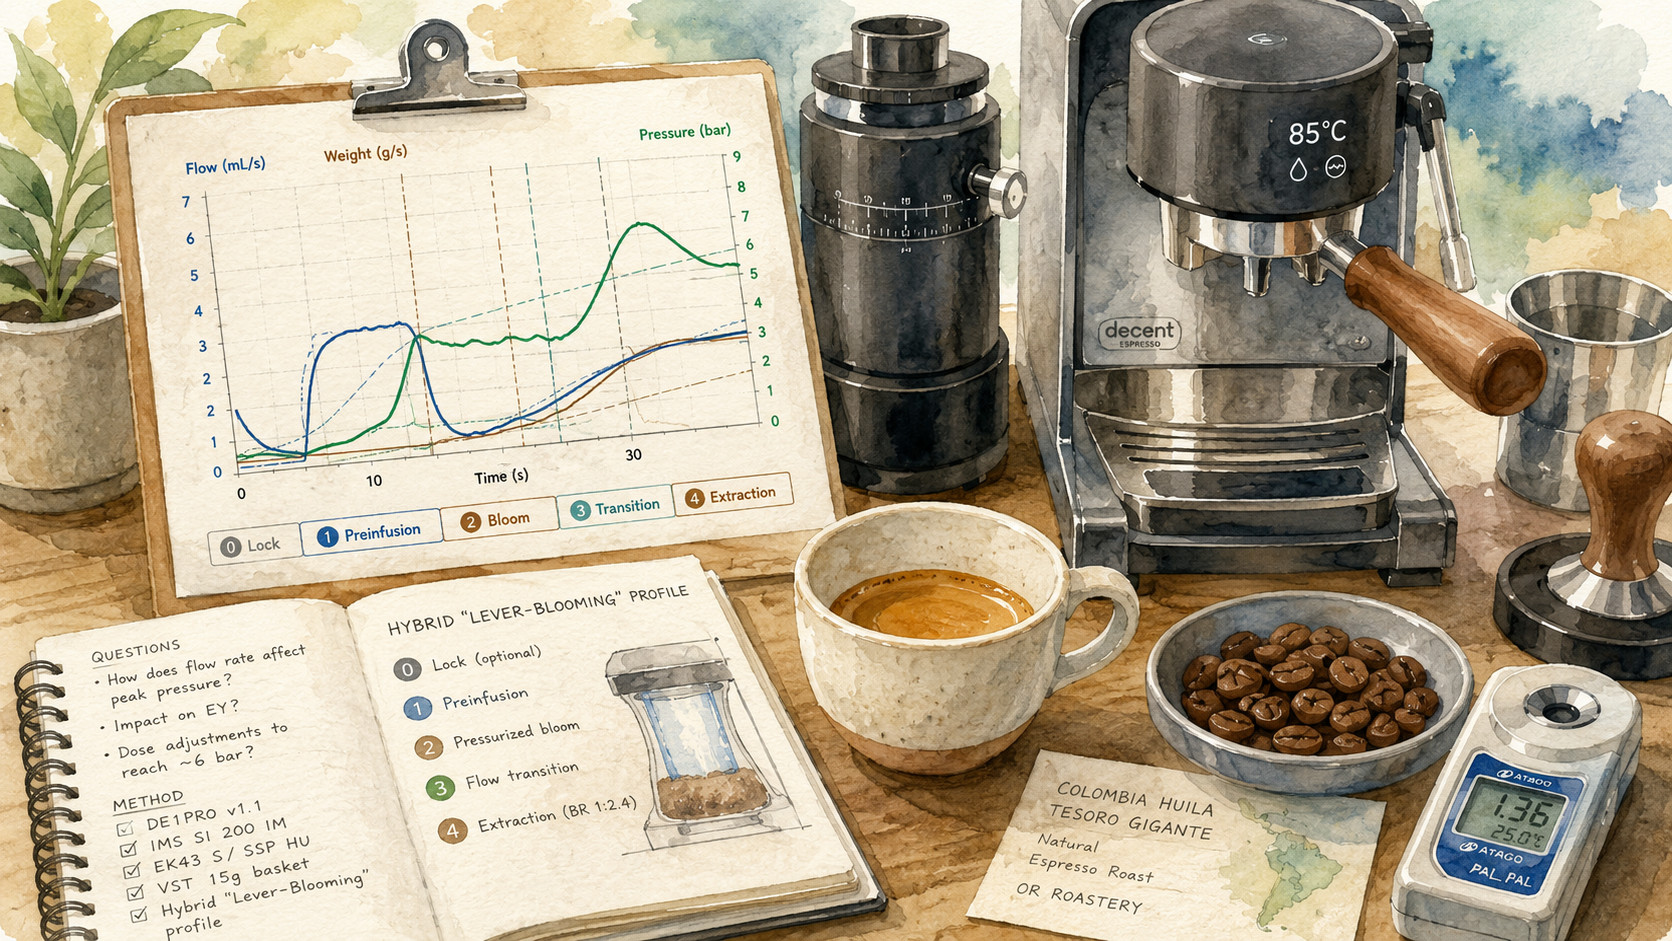
1. Introduction
This research by Stéphane Ribes (April 2020) evaluates the physical and chemical impacts of pre-infusion flow rates on espresso extraction dynamics using a light-medium espresso roast. By leveraging the Decent Espresso platform, the study examines how varying initial water flow rates during pre-infusion alter peak extraction pressure, espresso yield, total dissolved solids (TDS), and extraction yield (EY) while holding other variables like grind size and temperature constant.
2. Questions
3. Method
Below are the parameters used for the Hybrid "Lever" Blooming profile:
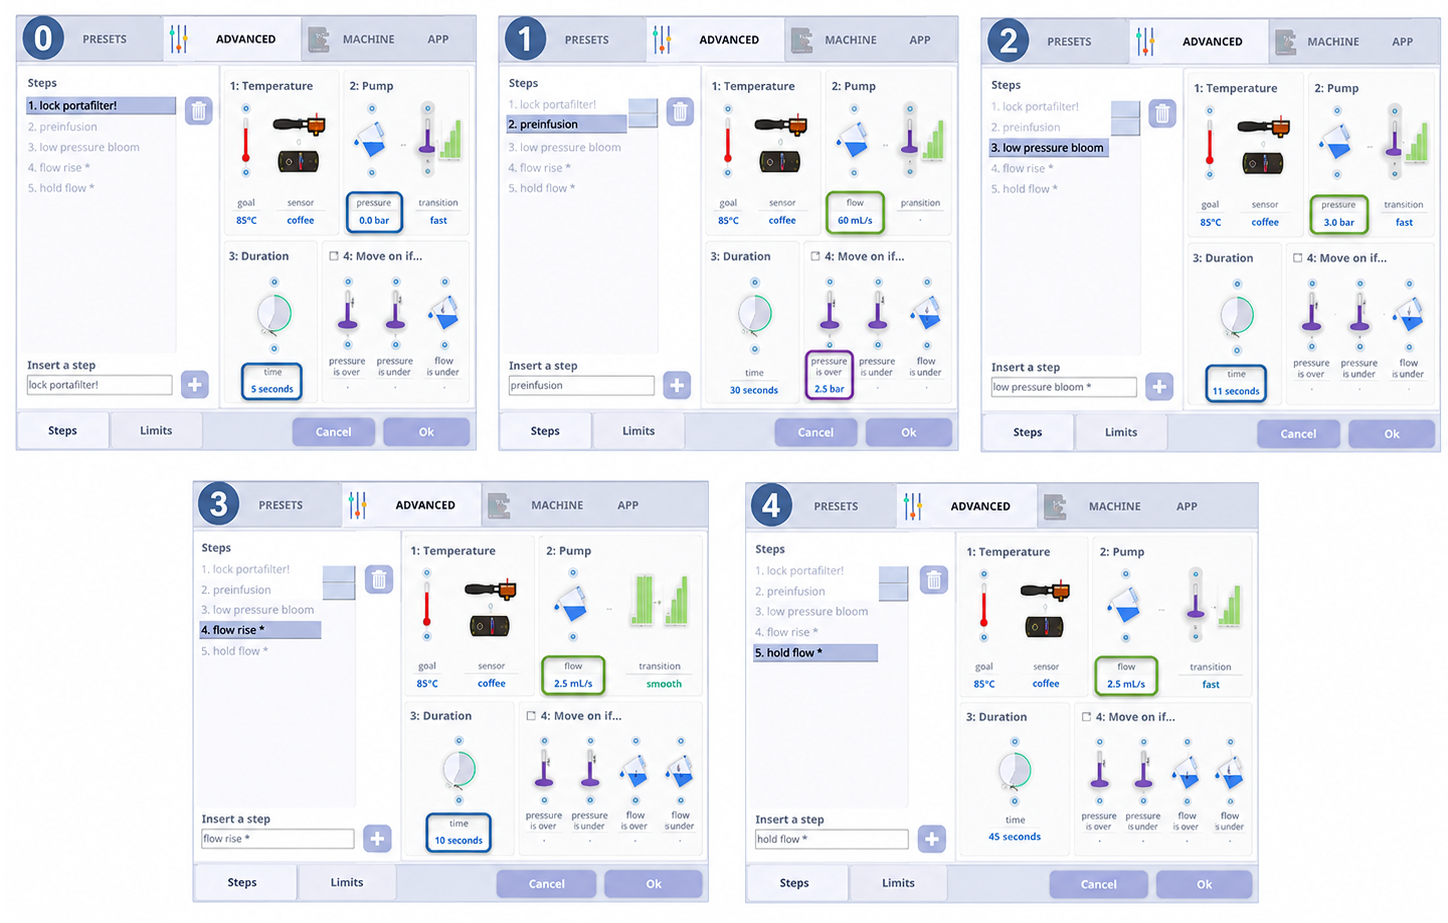
4. Proceeding
5. Results
Here's the results found via the experiments, first with a constant 13g dose and then adjusting the dose upwards or downwards:
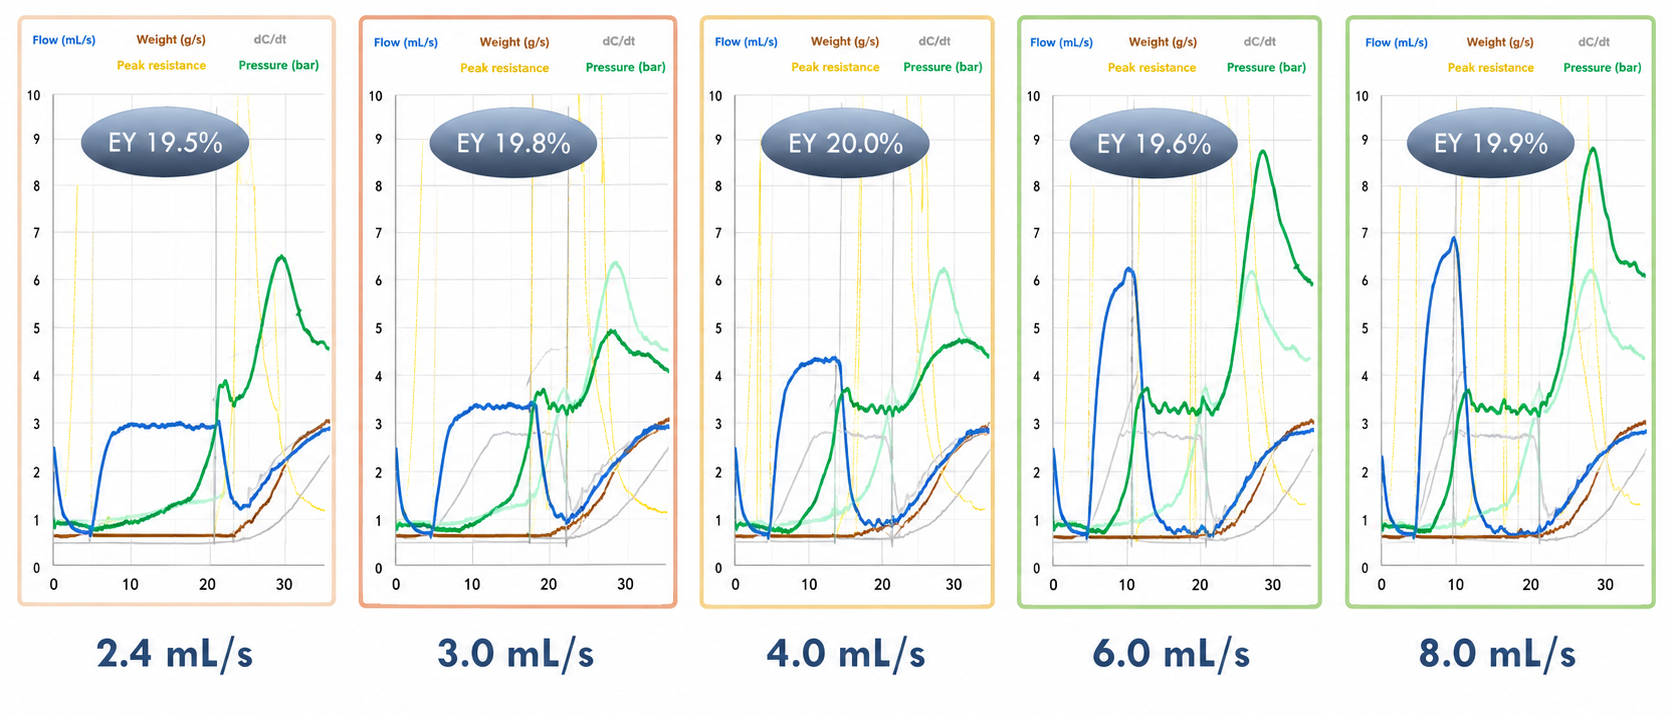
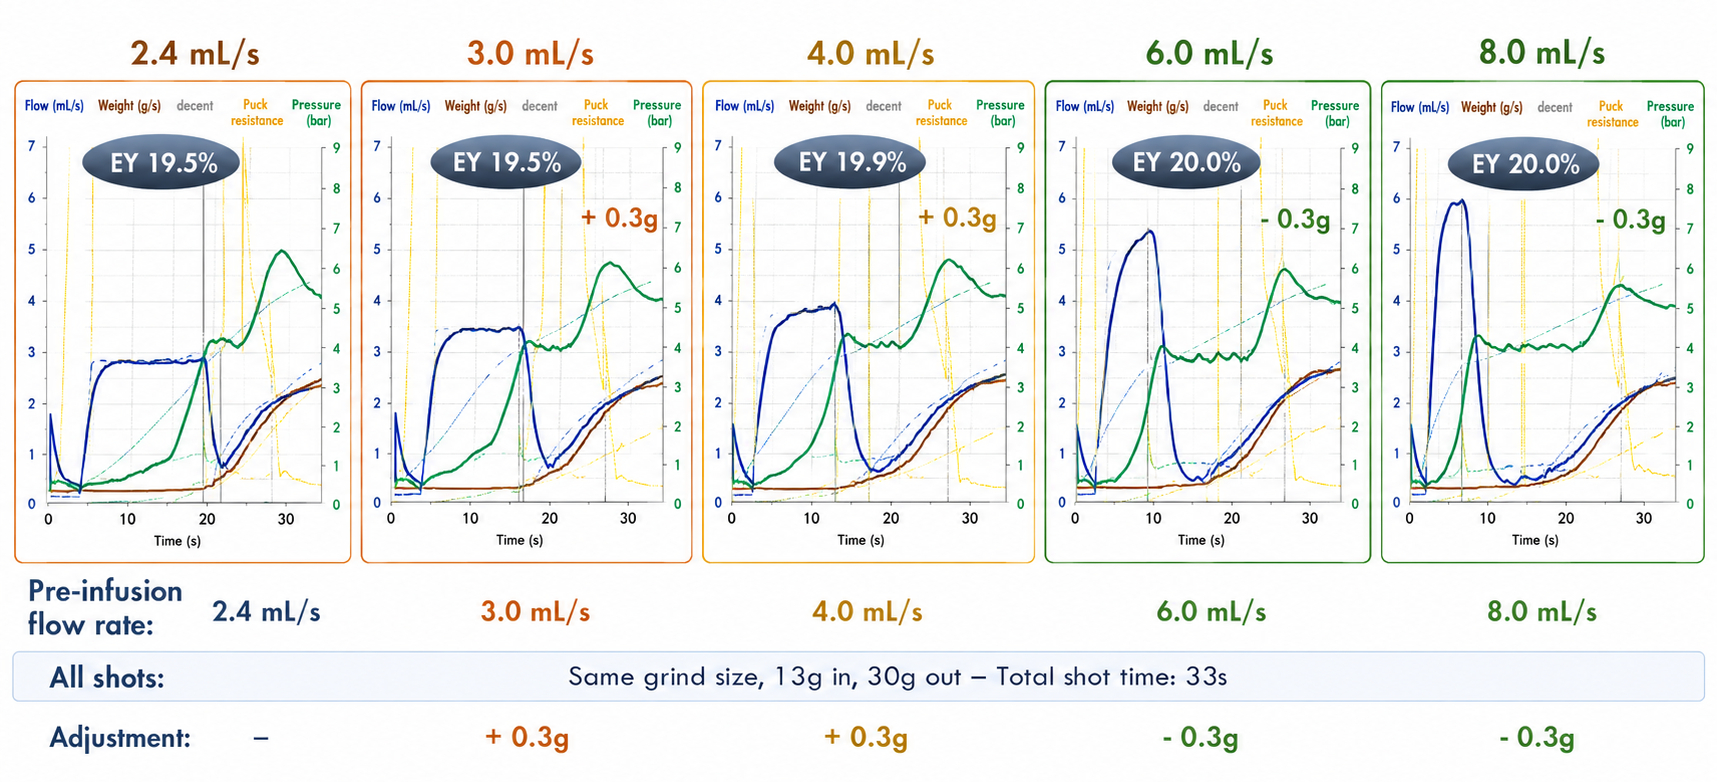
The following table shows all the results of the experiments in one view:
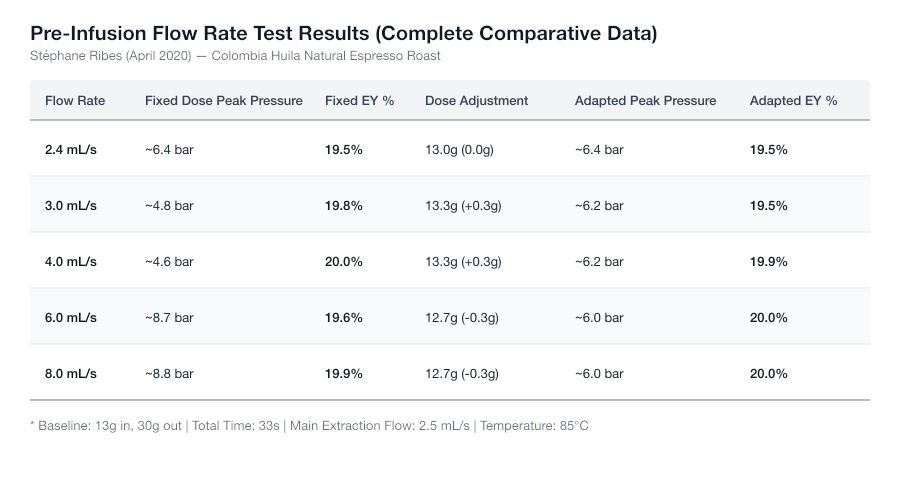
Said results reveal key insights into how pre-infusion flow rates shape extraction hydraulics and puck dynamics:
6. Conclusion
The experimental findings demonstrate how pre-infusion flow rates modulate coffee bed resistance and puck compression, establishing the necessary dose compensations to maintain target extraction pressures.
Easy Blooming: What ending preinfusion at a target pressure (dynamic bloom) and a pressure decline during extraction do to coffee

1. Introduction
This article is based on Stéphane Ribes' September 2020 Easy Blooming study, conducted on the Decent Espresso DE1PRO v1.1. The work investigates whether the conventional blooming-espresso approach can be made more tolerant of changes in grind size by replacing a bloom of predetermined duration with a dynamic bloom stage that ends when puck pressure reaches a defined threshold.
In a conventional blooming profile, the bloom lasts for a fixed period regardless of the hydraulic resistance of the coffee puck. If the grind is changed, however, water penetration and pressure development also change. Ribes therefore tested a pressure-triggered alternative: instead of ending the bloom after a fixed number of seconds, the machine advances to the next stage when measured pressure reaches a specified value.
The underlying hypothesis is that the bloom duration should adapt automatically to puck resistance. A coarser grind, which offers less resistance, should reach the pressure threshold sooner and therefore receive a shorter bloom. A finer grind should reach the threshold later and consequently receive a longer bloom.
The presentation states that this behavior makes extraction pressure less sensitive to grind variation and that espresso prepared at the most extreme grind settings was more enjoyable when the dynamic bloom was used.
The study then extends the concept further by combining dynamic blooming with pressure-priority extraction and a dynamic pressure decline. In this configuration, the rate of pressure decline changes according to the evolution of water flow, with the intention of stabilizing flow during the latter part of the extraction.
2. Questions asked
The experiments address six principal questions:
3. Method
Equipment and preparation protocol
The general test protocol used a Decent Espresso DE1PRO v1.1, a Mahlkönig EK43 S grinder fitted with SSP High Uniformity burrs with Silver Knight coating, and Montcalm water adjusted to 35 ppm CaCO₃-equivalent alkalinity and 112 ppm CaCO₃-equivalent total hardness using sodium carbonate and Epsom salts.
The portafilter and basket were preheated to 80°C in a kettle. Before every extraction, the basket and shower screen were dried completely with a clean tissue. Frozen beans were single-dosed and ground into a double-walled stainless-steel cup.
Puck preparation consisted of WDT in the basket using a homemade tool with three 0.4 mm needles and a Decent funnel, followed by gentle vertical taps. A Bravo Tamper, 58.50 mm in diameter, set to 36 lb, was used for tamping. For the tests performed on 19 September, a Hog puck-preparation tool with 0.8 mm needles was inserted and withdrawn vertically using a stand to ensure straight movement.
TDS measurements were performed with an Atago PAL refractometer, zeroed with the adjusted Montcalm water. Samples were not filtered and were measured at room temperature after vigorous stirring. Each reported data point represents the mean of three to five measurements.
Experiment 1: fast flow rise
The first experiment was conducted on 12 September 2020 using naturally processed Guatemalan coffee. The recipe was:
The profile used is called Easy Blooming. In the first round of the experiment, a 30-second fixed bloom was used followed by a 5-second ramp to 2.2 mL/s. In the second round of the experiment, the bloom ended when pressure reached 1.5 bar (dynamic bloom), followed by the same 5-second ramp to 2.2 mL/s.
Here's the settings for the 30-second fixed bloom step:

And here's the settings for the "Move on if...pressure is under 1.5 bar" (dynamic bloom) step:

Experiment 2: slow flow rise
The second test used the same coffee, dose, basket, output, shower screen, and grind range, but extended the post-bloom ramp to 12 seconds (vs. the 5 seconds in experiment 1).
The presentation contains one labeling inconsistency that should not be silently resolved: page 8 identifies the fixed comparator as a 20-second bloom, while page 9 identifies it as a 30-second bloom. Both slides specify a 12-second flow ramp to 2.2 mL/s. As in experiment 1, the first round of the experiment with a fixed bloom was followed by a dynamic bloom, which ended when pressure reached 1.2 bar.
Experiment 3: pressure-priority extraction with dynamic decline
A separate experiment was conducted on 19 September 2020 with anaerobically fermented Costa Rican coffee:
Both profiles used a dynamic bloom ending at 1.5 bar. The flow-priority comparator then used a 5-second ramp to 2.2 mL/s, whereas the alternative moved into a 6-bar pressure-priority extraction with dynamic pressure decline.
The presentation illustrates dynamic decline rates of approximately −0.2 bar/s, −0.1 bar/s, and −0.04 bar/s. A faster increase in water flow results in a steeper pressure decline.
4. Proceeding
For the flow-priority experiments, each profile was repeated across a sequence of six EK43 grind settings. The fixed-bloom profile was used as the reference, while the dynamic version replaced the time-based bloom termination with a pressure threshold.
The effect of the profile was then evaluated through:
The essential adaptive behavior can already be seen in the summary slide. With the same pressure-triggered bloom, the coarse EK1.9 grind receives an approximately 20-second bloom, whereas the fine EK1.4 grind receives an approximately 40-second bloom. A fixed-duration profile gives both grinds the same 30-second bloom.

The pressure-priority experiment subsequently examined whether dynamic blooming could be combined with an extraction whose pressure declines in response to flow behavior. The purpose was not simply to reduce pressure, but to make late-shot flow more uniform across grind settings.
5. Results
5.1. Fast flow rise
The fast-ramp experiment shows a clear difference in how shot duration responds to grind resistance. With the fixed bloom, total shot time remains relatively stable at roughly 57–60 seconds across most of the grind range. With dynamic blooming, coarse-grind shots become much shorter—approximately 46–47 seconds at EK1.9–EK1.8—while fine-grind shots become substantially longer, reaching roughly 68 seconds at EK1.5 and 73 seconds at EK1.4.
These values are approximate visual readings from the graph on the right, in which "Quick flow rise" is the shots with fixed bloom and the "Easy quick" line represents the shots with the dynamic bloom:

This is expected from the control logic: coarse pucks reach the 1.5-bar trigger rapidly, whereas finer pucks remain in the bloom stage for longer.
Extraction yield
Extraction yield remains comparatively insensitive to the bloom strategy. Both profiles cover roughly 22–25% EY, with the highest values at the coarser end and progressively lower yields toward EK1.4.
Approximate values from the graph are:

Thus, dynamic blooming does not materially increase EY across the entire range, although it appears to preserve slightly more extraction at the fine end.
Drippage before extraction
At coarse settings, dynamic blooming markedly reduces the beverage mass released before the main extraction stage. At EK1.9, the fixed bloom produces roughly 7.5–7.7 g of early drippage compared with approximately 5.8 g under dynamic bloom.
The relationship reverses toward the fine end. At EK1.4, the fixed profile produces less than approximately 1 g, whereas the dynamic profile produces around 3 g. Dynamic blooming therefore redistributes bloom duration according to puck resistance rather than minimizing drippage uniformly.
The graph showing the results is on the right-hand side. Again, in this context, "Quick flow rise" stands for the fixed bloom shot whereas "Easy quick" stands for the dynamic bloom shot.

Extraction pressure
The largest pressure peaks occur at the fine end of the grind range. Around EK1.5–EK1.4, peak extraction pressure approaches approximately 12–13 bar under the fixed profile. Dynamic bloom lowers these extreme peaks modestly, to approximately 11–12 bar.
To the right is the graph showing the extraction pressure results. Again, what's labelled "Quick flow rise" stands for the shot with fixed bloom, whereas "Easy quick" is the shot with dynamic bloom.

The difference is relatively small in the middle and coarse parts of the range, but it supports the presentation's central claim that extraction pressure becomes somewhat less sensitive to grind variation.
Sensory results with fast flow rise
The sensory graphs show the clearest advantage of dynamic blooming not at the optimum grind, but toward the edges of the grind range.
Both profiles produce their highest taste score around EK1.7, at approximately 8/10. At that grind, the two profiles are essentially equivalent.
At more extreme settings, however, the dynamic profile performs better:
Dynamic blooming also keeps sweetness relatively stable at approximately 3/5 across the range, whereas the reference profile falls to about 2/5 at several settings. Flavor clarity is likewise more stable, particularly around EK1.5. Astringency remains broadly comparable and does not show an obvious penalty from dynamic blooming.
Here's the taste scores of the coffee. As stated before, in our context, "Quick flow rise" is the fixed bloom shots, whereas "Easy quick" is the dynamic bloom shots:

The cup photographs are consistent with the quantitative results in showing usable espresso throughout the tested range, but the study's principal distinction is sensory rather than simply visual.

5.2. Slow flow rise
The slower 12-second ramp produces the same general adaptive behavior but with somewhat different hydraulic effects.
With a fixed bloom duration, total shot time of Easy Blooming is approximately 50–53 seconds across all grind sizes. With dynamic bloom (namely moving on once pressure reaches 1.5 bar) shot times vary much more widely: roughly 39–40 seconds at EK1.9–EK1.8, approximately 44–49 seconds in the middle, and approximately 56–61 seconds at EK1.5–EK1.4.
To the right is the graph showing the results. The shots with fixed bloom are labelled "Slow flow rise" whereas "Easy slow" stands for the dynamic bloom shots.

Extraction yield
Again, EY changes little between the two strategies.
Approximate values are:

The two profiles therefore produce broadly similar extraction yields despite substantially different bloom durations.
Drippage before extraction
Dynamic bloom has a large effect at coarse settings:
By EK1.7, the values converge near 2 g. At finer settings, the fixed bloom approaches virtually zero drippage, whereas the dynamic profile retains roughly 1 g.
To the right is the graph showing the results. Again, "Slow flow rise" stands for the fixed bloom shots whereas "Easy slow" stands for the dynamic bloom shots.

Pressure peak
Peak pressure rises sharply as the grind becomes finer.
At approximately EK1.5, the shot with fixed bloom reaches nearly 12 bar, while the dynamic bloom shot is closer to 10 bar. At EK1.4, both remain very high, but the dynamic bloom shot is still approximately one bar lower.
To the right-hand side is the graph showing the results. As before, the "Slow flow rise" stands for the fixed bloom shots whereas "Easy slow" stands for the dynamic bloom shots.

Thus, the pressure-triggered bloom again moderates, rather than eliminates, the increase in peak pressure caused by a much finer grind.
Sensory results with slow flow rise
The sensory data again indicate that dynamic blooming is most useful at the boundaries of the grind range.
The approximate overall taste scores are:

The improvement at EK1.4 is particularly notable. The fixed-bloom shot receives a very low score, while the dynamic version remains substantially more acceptable.
Dynamic bloom also preserves flavor clarity at the finest grind. The reference profile falls from approximately 3/5 to 1/5 at EK1.4, whereas the dynamic profile remains near 3/5. Bitterness at the fine extreme is also slightly lower, approximately 3/5 rather than 4/5. Sweetness and mouthfeel are generally equal or slightly better with dynamic bloom.
Here's all the results from the sensory analysis:

These results directly support Ribes' summary that the most extreme grind settings were more enjoyable when the bloom duration was pressure-triggered rather than fixed.
As in the previous experiment, the coffees looked fine from a visual perspective. However, what really matters when drinking coffee is that it tastes well:

5.3. Pressure-priority extraction with dynamic pressure decline
The final experiment extends the concept from bloom control into the extraction itself.
Both profiles begin with a bloom ending at 1.5 bar. In the first round of experiments, flow then ramps up to 2.2 mL/s over five seconds and is held constant. The alternative enters a 6-bar pressure-priority phase whose pressure declines dynamically.
Extraction yield is very similar between the two methods, remaining approximately 22.5–23.5% throughout the EK2.1–EK1.6 range.
There is no consistent EY advantage for either strategy.
Sensory consistency, however, improves with pressure decline.
Approximate taste scores are:

Here's all the results from the sensory analysis. The "Easy quick flow" stands for the shots with fixed flow and the "pressure decline" speaks for itself:

The conventional flow-priority version reaches a slightly higher peak score at EK1.9, but its performance deteriorates rapidly toward the finest grind. In contrast, the dynamic-decline profile remains relatively stable.
The same pattern appears in other sensory variables. Mouthfeel with dynamic pressure decline remains near 2–3/5 rather than dropping to approximately 1/5 at coarse settings. Flavor clarity remains close to 3/5 throughout the entire range, whereas the flow-priority profile rises to approximately 4/5 around EK1.8 before collapsing toward roughly 1/5 at EK1.6. Bitterness and astringency remain restrained.
The presentation therefore concludes that combining dynamic bloom with pressure-priority extraction further widens the usable grind range and that dynamically increasing the pressure-decline rate as flow rises produces more consistent flow late in the extraction.
6. Conclusion
Taken together, the experiments indicate that “Easy Blooming” is primarily a robustness strategy rather than a mechanism for substantially increasing extraction yield. A pressure-triggered bloom allows the profile to adapt its duration to puck resistance, reducing sensitivity to grind-size variation and improving sensory performance when the grind is considerably coarser or finer than the apparent optimum. The subsequent addition of dynamic pressure decline extends that principle into the extraction phase and improves consistency across an even broader grind range.
1. Can a pressure-triggered dynamic bloom make extraction less sensitive to grind size than a fixed-duration bloom?
2. How does dynamic blooming affect bloom duration, shot time, drippage, pressure, extraction yield, and sensory quality?
3. Does dynamic blooming improve espresso at the coarse and fine extremes?
4. How does the behavior differ between fast and slow post-bloom flow rises?
5. Can pressure-priority extraction with dynamic pressure decline further widen the usable grind range?
6. Does dynamic pressure decline make the final extraction flow more consistent?
Easy Blooming, compared to the Default and Gentle & Sweet profiles

Introduction
This experiment by Stéphane Ribes (October 2020) evaluates the performance of the "Easy Blooming" espresso pressure profile in comparison to two standard Decent Espresso profiles: "Default" and "Gentle & Sweet". The study investigates how extraction dynamics across various grind sizes influence sensory attributes and overall extraction yield. Here's the slides of this presentation.
2. Questions asked
3. Method
4. Proceeding
5. Results
Below are the resulting charts showing the results of the experiments:

The Default profile's highest taste score occurs around EK1.4, at approximately 6/10. Extraction yield rises toward the fine end, eventually reaching about 23.1% at EK1.0, but taste score declines sharply there.
Acidity is strongest at the coarse settings and falls continuously as the grind becomes finer. Mouthfeel follows a similar downward tendency.
In contrast, Gentle & Sweet produces comparatively stable acidity, mostly around 2–2.5, and extraction yield rises gradually as the grind becomes finer.
Its overall taste score improves from the coarse end but levels off at roughly 4.5/10 from EK1.4 onward. It never reaches the highest overall taste scores recorded by Default or Easy Blooming.
The winner among the profiles is Easy Blooming. It reaches approximately 23.4% at EK1.4, the highest plotted extraction yield in the experiment. Its taste score rises progressively from approximately 4 at EK2.0 to a maximum of approximately 7 at EK1.2. Clarity also peaks at 4 at EK1.2, higher than either comparison profile. Sweetness reaches about 3 from EK1.6 onward. Astringency decreases toward the finer settings and reaches its minimum, approximately 1.5, at EK1.2. The finest tested setting, EK1.0, does not continue improving the cup.
Although extraction yield remains high, taste score drops from about 7 to 5.5, mouthfeel falls to about 1, and clarity falls from about 4 to 3.
Below is a chart of the best scores of each profile, showing Easy Blooming outdoing the other profiles:

To summarize, the following overall best scores were achieved:
6. Conclusion
Based on the sensory data and extraction trends captured across the profile test runs, the evaluated research questions yield the following findings:
Accessories
Evaluating what Michael's spacer and various shower screens do to coffee

1. Introduction
In November 2019, Stéphane Ribes conducted several experiments to evaluate the impact Michael's 3.8mm brass spacer has on coffee made with a DE1PRO v1.1 espresso machine from Decent Espresso. A spacer is a device installed between the group-head shower and the water-diffusion screen, usually used to reduce head space (the distance between the upper surface of the puck and the shower screen).
The study, which can be downloaded here, examined whether changing the position of the shower screen—and therefore reducing head space—would influence pressure behavior, extraction uniformity, extraction yield, and sensory performance.
The spacer was not tested in isolation. Instead, Ribes compared four shower-screen configurations representing different degrees of protrusion into the basket and different puck-to-screen distances.
The four configurations were as follows:

All configurations were tested with a 15 g dose. The IMS CI 35 WM plus spacer created the greatest intrusion into the basket and therefore the most restricted headspace.
The central hypothesis is that reducing the puck-to-screen distance (aka headspace) might change the hydraulic behavior above the puck, produce a gentler pressure decline following peak pressure, and potentially improve extraction uniformity and cup quality.
2. Questions asked
The following questions can be inferred from Stéphane's presentation:
3. Method
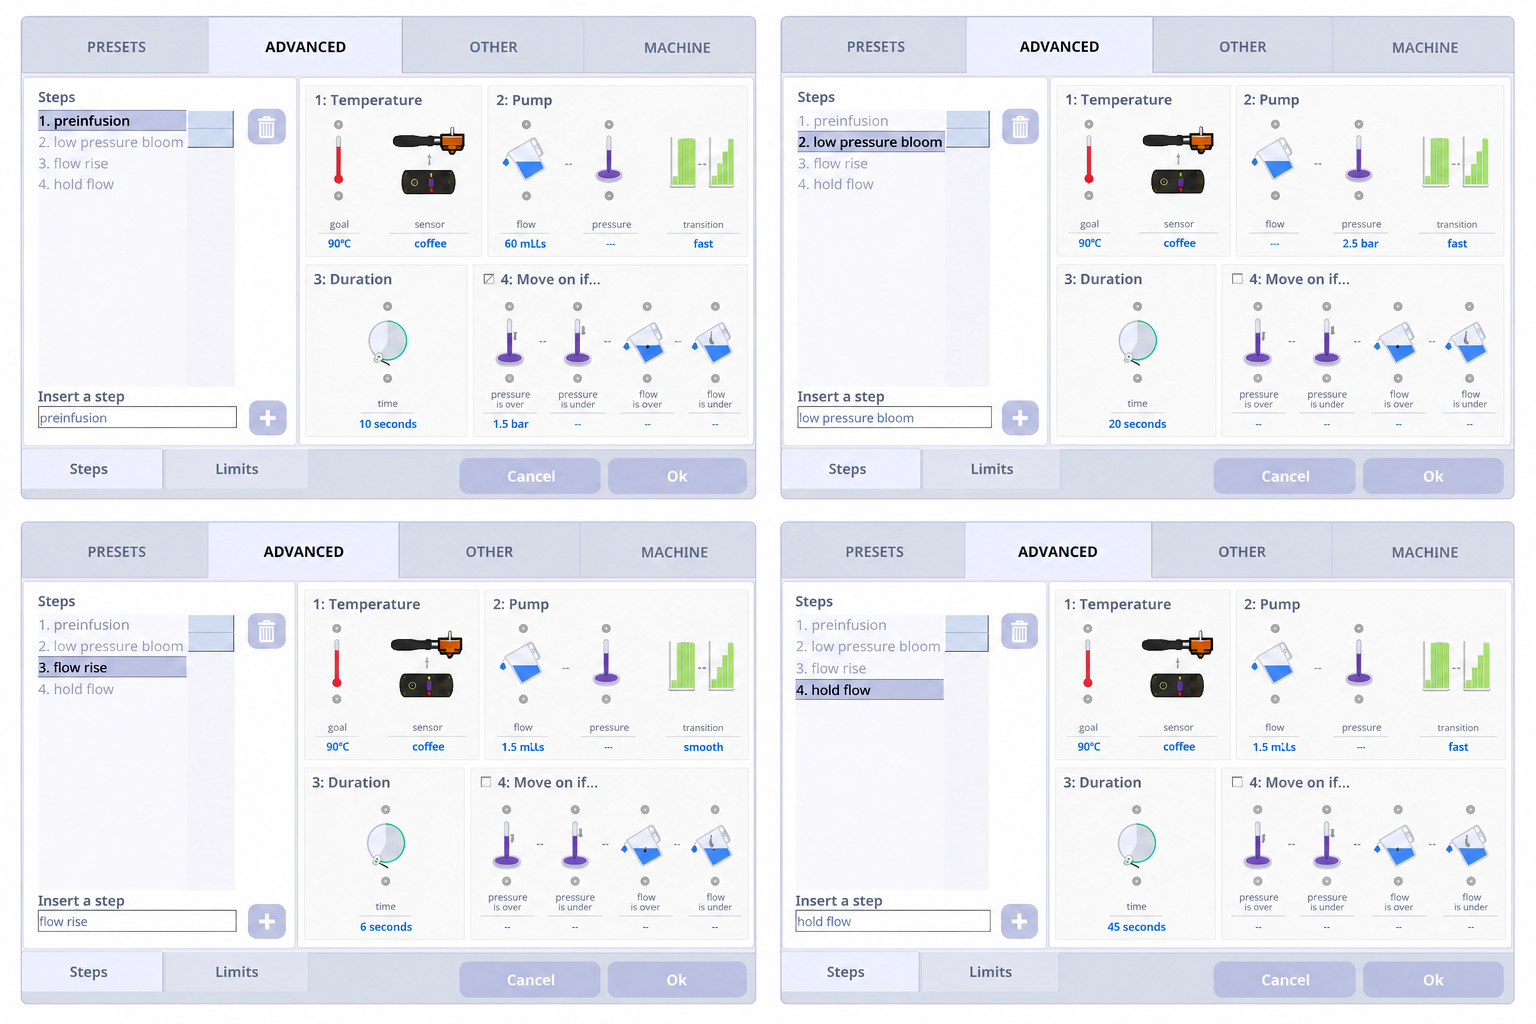
Here's what the four programmed stages look like:

Thus, the profile intentionally separates rapid initial wetting from a pressure-controlled bloom and then raises flow progressively before maintaining a fixed flow.
4. Proceeding
The four configurations of shower screens and spacers tested were as follows:
The IMS CI 200 IM screen used was the standard screen included with the Decent Espresso machine. So it being tested without the spacer provided the baseline. The latter three configurations progressively moved the shower screen toward the puck, with the CI 35 WM plus spacer creating the smallest available head space.

Coffee was brewed in all configurations and the resulting espresso, basket/puck surface, shower screen, and knocked-out puck were documented.
First pressure comparison: similar maximum pressure
In the first round of experiments, the dose, extraction parameters, and workflow were held constant at 15 g. When the IMS CI 200 IM screen was used with the spacer, the grinder was tightened slightly, from EK1.3 to EK1.25, so that a similar maximum extraction pressure could be reached.
The primary measurement was the percentage pressure decline following the maximum pressure peak.
Second pressure comparison: identical grind setting
In the second round of experiments, the grinder was fixed at EK1.4, while maintaining the same extraction parameters and workflow.
The exception was the IMS CI 35 WM screen plus spacer. Because this arrangement placed the shower screen especially close to the puck, the dose had to be reduced from 15.0 g to 14.5 g to prevent direct puck-to-screen contact.
Pressure-level comparison
For each of the configurations, shots were brewed and compared at:
The following sensory and visual comparisons were then made:
Results
5.1. Pressure decline after peak pressure
The first round of experiments found that with either the spacer or the IMS SI 200 IM screen installed, the pressure decline after maximum pressure was gentler.
The first comparison, in which maximum pressure was approximately matched, produced the following results:

The standard CI 200 IM arrangement therefore produced the steepest decline, losing roughly half of its peak pressure. Adding the spacer reduced that decline by approximately six percentage points.
The IMS SI 200 IM without a spacer behaved similarly to the CI 200 IM plus spacer, supporting the idea that screen position and head space—not merely the presence of a brass component—were responsible for much of the change.
The most extreme geometry, CI 35 WM plus spacer, produced by far the gentlest decline at approximately −30%, although its extraction yield in this test was also the lowest at 18.5%.
5.2. Same-grind comparison at EK1.4
At an identical EK1.4 grind setting, the same pattern appeared:

Again, the standard CI 200 IM produced the greatest pressure loss. The brass-spacer version and protruding IMS SI 200 IM screen both moderated the pressure decline substantially, while the CI 35 WM plus spacer once again produced the smallest drop.
Ribes thus noted again that less headspace, be it through a spacer or a shower screen, lead to a gentler pressure decline.
5.3. Experiments comparing the configurations at 6-7 bar vs 9-10 bar
Extraction yield at 6–7 and 9–10 bar
The combined extraction-yield chart gives the following values:

The results therefore do not show a general extraction-yield increase from adding the spacer. The conventional CI 200 IM arrangement actually produced the highest measured EY, approximately 19.5%, in the high-pressure condition.
The spacer's clearest benefit was instead in pressure behavior and visual extraction characteristics.
The CI 35 WM plus spacer is particularly revealing: despite producing the gentlest pressure decline, its extraction yield did not increase and actually fell to approximately 18.5% at 9–10 bar.
Visual extraction uniformity
Ribes separates visual uniformity into observations from the bottomless portafilter and the spent puck. Here's the charts showing his assessments:

And here's what the spent pucks looked like:

The standard IMS CI 200 IM configuration showed reasonable visual uniformity from the bottomless portafilter—particularly at 6–7 bar—but very poor visual puck uniformity at both pressure levels.
Adding the spacer to the CI 200 IM changed this markedly. Both the bottomless-portafilter assessment and the puck assessment moved toward the high-uniformity end of the graphical scales, and the 6–7 and 9–10 bar results were relatively close together.
The IMS SI 200 IM configuration also displayed comparatively high puck uniformity, although bottomless-portafilter uniformity was better at 6–7 bar than at 9–10 bar.
The CI 35 WM plus spacer behaved similarly: puck uniformity appeared strong at both pressures, while the bottomless-portafilter assessment was better at 6–7 bar than at 9–10 bar.
Taken together, these visual assessments support the hypothesis that reducing the distance between the screen and puck can improve the apparent uniformity and structural condition of the puck, even when extraction yield itself does not rise.
Taste assessment and taste scoring
Ribes then went ahead and evaluated the coffees made with each shower screen and spacer configuration for their body, acidity, sweetness, flavor, bitterness, astringency, and he also gave them an overall taste score. Here's the results:

Sensory results: standard IMS CI 200 IM
With the standard screen and no spacer, the sensory plot shows clear pressure-dependent differences.
At approximately 6–7 bar, the cup retained more acidity and flavor and exhibited somewhat less bitterness.
At 9–10 bar, the profile showed:
The overall taste score appears to be only about 2–3/10, with the lower-pressure version scoring slightly better than the higher-pressure shot.
Thus, the baseline screen configuration performed relatively poorly sensorially in this test.
Sensory results: IMS CI 200 IM plus spacer
Adding the brass spacer produced a substantially more balanced sensory pattern.
The differences between the 6–7 and 9–10 bar shots became comparatively small:
The total taste scores rise to approximately 4–4.5/10, noticeably above the unmodified CI 200 IM configuration.
This suggests that even though extraction yield was slightly reduced, cup balance improved.
Sensory results: IMS SI 200 IM
The protruding IMS SI 200 IM screen produced one of the strongest sensory outcomes in the experiment.
Its cups showed:
The overall taste score is approximately 5–5.5/10, substantially higher than the standard CI 200 IM and slightly higher than the CI 200 IM with spacer.
This reinforces the idea that the observed improvements were connected to screen geometry and reduced headspace, rather than being unique to the brass spacer itself.
Sensory results: IMS CI 35 WM plus spacer
The CI 35 WM plus spacer produced the greatest reduction in puck-to-screen distance and also yielded the highest plotted overall taste score.
At 6–7 bar, the cup shows approximately:
Its taste score is approximately 6/10, the highest individual result shown on the page.
At 9–10 bar, however, acidity and sweetness drop, while the overall taste score falls to approximately 4–4.5/10.
The configuration therefore appears to work particularly well at the lower 6–7 bar pressure range, rather than benefiting from a higher peak extraction pressure.
5.4. Overall comparison of all four shower screen and spacer configurations
The results reveal several important distinctions:

The experiment therefore separates two concepts that are often treated as equivalent: higher extraction yield and better extraction quality were not the same thing here.
The standard shower screen without space (baseline) generated the highest measured extraction yield, yet it showed the steepest post-peak pressure decline, the weakest puck-uniformity assessment, and the poorest taste results.
Conversely, configurations that reduced headspace produced smoother pressure behavior and generally better sensory scores even when their extraction yields were slightly lower.
6. Conclusion
Taken as a whole, Ribes's experiments suggest that reducing headspace can materially change the hydraulic and sensory behavior of a Decent espresso extraction, but the benefits are expressed more clearly in pressure stability, puck uniformity, and cup quality than in extraction yield alone.
Based on the results, we can now answer the questions brought up in chapter 2 as follows:
1: Does installing the 3.8 mm brass spacer—or using a shower screen that similarly reduces headspace—change the pressure decline after the maximum extraction-pressure peak?
2: Does reducing headspace improve extraction uniformity, as judged visually from the bottomless-portafilter extraction and the spent puck?
3: How does the spacer or altered shower-screen geometry affect extraction yield?
4: How do the different spacer/screen configurations affect sensory attributes and overall taste score at approximately 6–7 bar and 9–10 bar extraction pressures?
5: Which of the four tested configurations appears to provide the best overall compromise between hydraulic behavior, extraction uniformity, extraction yield, and taste?
The central lesson of the experiments is therefore that shower-screen geometry and headspace can significantly influence espresso behavior even when conventional extraction-yield measurements change only modestly. The experiments suggest that reducing the air space above the puck can stabilize the extraction after peak pressure and potentially produce a more uniform and better-tasting espresso, but reducing headspace too far introduces practical constraints such as puck-screen contact and the need to lower the dose.
Reneka micro-sieve vs VST and IMS precision baskets: Hydraulic, extraction and sensory effects in espresso

1. Introduction
In December 2019, Stéphane Ribes conducted a comparative espresso experiment using a Decent Espresso DE1 Pro v1.1 to investigate whether the choice of filter basket should depend on the characteristics, or in the author's wording the “quality,” of the coffee beans. The specific comparison was between a Reneka Micro-Sieve basket, a VST 15 g ridgeless precision basket, and an IMS precision basket. His presentation can be found here.
The experiment is particularly interesting because the three baskets differ substantially in construction. The IMS B702TFh22NT is specified as having 715 holes of 0.300 mm diameter. The Reneka Micro-Sieve is specified as having approximately 15,000 holes of 0.170 mm diameter, while the VST 15 g precision basket contains 727 holes, although the hole diameter is not provided in the presentation. The diagram also labels the Reneka at 40 mm and the IMS/VST at 49 mm, although it does not state unambiguously whether those dimensions refer to the complete basket bottom or the active perforated region.
Thus, the Reneka is not simply another conventional precision basket. It uses roughly 21 times as many holes as the IMS, with each opening substantially smaller. The experiment therefore compares two broadly conventional precision-basket designs, IMS and VST, with a fundamentally different micro-sieve architecture.
The central outcome of the experiment is a trade-off. The Reneka produced a much more stable extraction-pressure profile, but simultaneously caused a large reduction in measured extraction yield. Sensory evaluation nevertheless suggested that, for the coffee used in this experiment, this lower-extraction behavior could be advantageous when the VST and IMS baskets emphasized unpleasant roasting notes. The presentation also reports no major practical difference between the VST and IMS baskets.
This means that the study is not really asking which basket is universally “best.” It asks whether different hydraulic and extraction characteristics can make different baskets more suitable for different coffees.
2. Questions asked
The presentation explicitly asks whether a different filter basket might be appropriate depending on bean “quality.” From the actual experimental design, this overarching question can be divided into five research questions:
3. Method
Experimental design
The experiment used three filter baskets:
Each basket was tested at two Mahlkönig EK43 S grinder settings:
Espresso equipment
The setup consisted of:
Water
Montille water from Le Mont-Dore, France, was modified to 50 ppm as CaCO₃ alkalinity and 100 ppm as CaCO₃ total hardness using sodium carbonate and Epsom salts.
This is important because water composition strongly affects extraction and sensory perception. Holding it constant reduces one source of variability between basket conditions.
Coffee
The coffee shown in the protocol is La Candelilla, a honey-processed grain from Costa Rica, which was roasted (filter roast) roughly a month before the experiment.
Puck preparation
Preparation was deliberately standardized. Before every shot, the basket and shower screen were thoroughly dried with a clean tissue. Frozen beans were single-dosed and ground into a double-walled stainless-steel cup. The grounds were distributed using WDT with a Londinium tool and a Decent funnel, without tapping. Tamping was performed with a Force Tamper with a 58.5 mm flat base, applied twice consecutively.
Every shot used:
14.5 g ground coffee → 29 g espresso
giving a fixed 1:2 brew ratio.
Extraction and TDS measurements
TDS was measured with an Atago PAL refractometer, zeroed using SCAA water. Coffee samples were not additionally filtered, were measured at room temperature after thorough agitation, and each reported data point was the average of three to five refractometer measurements of the same coffee sample.
4. Proceeding
The DE1 was programmed with a profile described as a mixture of a Londinium profile and a blooming shot. The extraction consisted of four phases, which are illustrated below:

Step 1 – Preinfusion
The profile uses an initial preinfusion at approximately:
The aim is to saturate the puck rapidly before entering the bloom.
Step 2 – Low-pressure bloom
The profile then enters a low-pressure bloom at approximately:
The purpose of this stage is to maintain a relatively constant volume of the air pocket above the puck. The intention is to limit further damage to the puck surface when water flow is subsequently increased.
Step 3 – Flow rise
After the bloom, flow is increased toward approximately:
This gradual increase is intended to avoid a sudden hydraulic shock to the coffee bed.
Step 4 – Flow hold
The final stage maintains approximately:
with the profile showing a maximum duration of 45 seconds. In practice, the shots terminate once the target beverage mass of 29 g is reached.
The significance of using flow priority is that flow is the principal controlled variable during the extraction phase. Pressure is therefore especially useful as a response variable: it indicates how much hydraulic resistance the puck-and-basket system develops while the machine attempts to impose the programmed flow.
The experiment then compares, for every basket and grinder setting:
5. Results
5.1. Quantitative pressure and extraction-yield results
The measured results were:

The maximum pressures themselves are not dramatically different between baskets at a given setting. At EK1.2, all three peak close to 10 bar; at EK1.3, all three peak close to 7 bar.
The major difference emerges after the pressure peak.
At EK1.2:
Reneka therefore retains approximately 87% of its peak pressure, compared with about 32% for IMS and 36% for VST.
At EK1.3:
Reneka retains approximately 81% of its peak pressure, compared with about 42% for IMS and 49% for VST.
This quantitatively confirms the presentation's main hydraulic observation: the Reneka produces a much softer pressure decline after peak pressure.
5.2. Interpretation of the pressure graphs
The six DE1 graphs below from on page 7 of Stéphane's presentation make this behavior particularly clear:

During preinfusion and bloom, the traces are broadly similar because the machine follows the same programmed sequence. The differences become pronounced when the main flow phase begins.
With IMS and VST, pressure rises sharply to a peak and then continuously collapses as the shot progresses. With the Reneka, pressure also peaks, but instead of collapsing, it reaches a comparatively stable plateau.
This distinction is reproducible at both grinder settings.
The pressure curves therefore suggest that the combined hydraulic resistance of the puck and Reneka basket changes much less during the latter portion of the extraction. The experiment does not, however, establish the exact physical mechanism responsible. Possible contributions could include basket geometry, flow distribution or the interaction of fines with the micro-sieve, but these mechanisms were not separately tested.
The important empirical observation is simply that the Reneka provides a much more constant pressure response when flow is prescribed.
5.3. Pressure stability does not mean higher extraction
One of the most important lessons from these results is that a stable or high pressure is not equivalent to high extraction.
Despite maintaining considerably more pressure throughout the latter part of the shot, the Reneka produces the lowest extraction yield by a large margin:
The difference is approximately 3.4–3.7 percentage points, which corresponds to roughly a 17–19% relative reduction in extraction yield compared with the conventional precision baskets.
Because every shot uses 14.5 g of coffee and produces 29 g of beverage, the brew ratio is exactly 2:1. Using the conventional relationship between extraction yield, beverage mass, dose and TDS, the reported yields imply approximate beverage concentrations of:
Thus the Reneka shots were not merely lower in extraction yield; at the same beverage mass, they were also substantially less concentrated.
This is crucial when interpreting the sensory result. The improved perceived clarity with the Reneka may result partly from producing a less highly extracted and less concentrated espresso, rather than from the micro-sieve selectively removing specific undesirable compounds.
5.4. Effect of the two grinder settings
Moving from EK1.2 to EK1.3 reduced peak pressure with all three baskets:
The remarkable point is that extraction yield barely changed:
Within this relatively small adjustment range, the basket design had a far larger effect on extraction yield than the grinder-setting change.
At the same time, sensory preference changed considerably, particularly for the Reneka and VST. This demonstrates that a virtually identical extraction-yield number does not guarantee an identical-tasting espresso.
5.5. IMS versus VST
IMS and VST behaved very similarly.
At EK1.2 they produce almost identical peak pressures, similarly steep post-peak declines, and exactly the same reported extraction yield of 19.8%.
At EK1.3 the pattern remains close: 7.2 versus 6.8 bar maximum pressure, 3.0 versus 3.3 bar final pressure, and 19.7 versus 20.0% extraction yield.
This directly supports Ribes' statement that there were “no major differences between the VST 15g and IMS precision filter baskets.”
The basket comparison is therefore primarily Reneka versus conventional precision baskets, rather than a meaningful IMS-versus-VST contest.
5.6. Post-shot puck photographs
The page 6 photographs of the presentation, illustrated below, document the puck surface, basket after extraction, espresso and removed spent puck for each condition.

At EK1.2, all three removed pucks appear comparatively intact. At EK1.3, the IMS puck shown in the photograph is visibly fractured, whereas the photographed Reneka and VST pucks remain more intact.
This should not be treated as direct proof of channeling. A puck can crack during depressurization or removal. The photographs are therefore useful supporting observations, but the pressure and extraction measurements provide stronger evidence than the appearance of a single spent puck.
5.7. Sensory results
The final slide in Ribes' presentation compares six sensory attributes:
body, acidity, bitterness, sweetness, flavor and astringency, together with an overall taste score on a 0–10 scale. It is illustrated below:

The exact taste-score values are not printed numerically, so the following values are approximate readings of the marker positions.
For EK1.2:
For EK1.3:
The clearest visual result is therefore the relatively high preference for Reneka at EK1.3, while VST at EK1.2 appears to be the least favored condition.
The intensity plots add nuance. Across the conditions, acidity is generally medium to high, whereas sweetness, flavor intensity and astringency occupy lower portions of their scales. The Reneka EK1.3 cup combines relatively strong acidity and bitterness with comparatively low astringency, yet obtains the highest overall taste score.
This is significant because it shows that the preference for the Reneka was not simply a matter of minimizing bitterness. Ribes instead characterizes the result as higher flavor clarity, specifically in a situation in which the VST or IMS shots displayed unpleasant roasting notes.
In other words, the sensory advantage appears to concern balance and clarity rather than the absolute intensity of any single taste dimension.
5.8. The central trade-off
Taken together, the results identify a clear trade-off:
IMS/VST
Reneka
Consequently, the Reneka cannot simply be described as technically “better.” It produces a different extraction regime.
6. Conclusion
The experiments show that basket architecture can substantially change espresso behavior even when the coffee dose, beverage mass, grinder, puck preparation, water and machine profile are held constant. The most striking result is the separation between hydraulic behavior and extraction: the Reneka maintains much more pressure throughout the shot while extracting considerably less coffee material.
For the specific Costa Rican coffee tested, that lower-extraction regime was not necessarily undesirable. On the contrary, it could reduce the prominence of unpleasant roasting characteristics and yield a cup perceived as clearer and, in the best-performing condition, more enjoyable.
The data therefore argue against the idea that the basket with the highest extraction yield or the most stable pressure is automatically superior. Basket choice can be understood as another variable for shaping extraction and sensory expression.
The five questions posed at the beginning can now be answered as follows.
1. Does the Reneka Micro-Sieve produce a different pressure profile from the IMS and VST precision baskets when the espresso machine is operated in flow-priority mode?
2. Does the Reneka Micro-Sieve change extraction yield when dose, beverage mass, preparation and grinder setting are held constant?
3. Do the hydraulic and extraction differences translate into a different sensory profile or overall taste quality, particularly when unpleasant roasting notes are present?
4. Is there a meaningful difference between the VST 15 g and IMS precision baskets?
5. Do the results support choosing a filter basket according to the characteristics or “quality” of the beans?
The presentation consequently provides evidence that the filter basket can be treated as an active extraction variable rather than merely as a passive container for the coffee bed. At the same time, broader testing across coffees, roast levels, matched extraction yields and blind replicated tastings would be required before establishing a general rule for selecting baskets according to bean quality.
IMS CI 200 IM vs IMS SI 200 IM: Effects on espresso pressure, Extraction Yield, puck structure, and radial uniformity

1. Introduction
In March 2020, Stéphane Ribes compared two IMS shower screens—the IMS CI 200 IM and IMS SI 200 IM—on a Decent Espresso DE1PRO v1.1. The slides of the presentation can be found here.
The purpose of the experiment was not simply to determine whether one screen produced a higher extraction yield, but to examine how changing the shower screen affected the complete espresso system: pressure development, pressure decline during a flow-controlled extraction, extraction yield (EY), puck behavior after brewing, sensory properties, and the radial uniformity of extraction from the center of the puck to its outer edge.
The distinction is important because a shower screen can affect more than the visible distribution of water. By changing the geometry above the coffee puck and the available clearance for puck expansion, it can influence how the puck wets, swells, resists flow, and maintains its structure during extraction. Those changes can then be reflected in the machine's pressure curve and in how evenly different parts of the coffee bed are extracted.
2. Questions asked
The experiment can be organized around five principal questions:
3. Method
Espresso equipment
The experiment was performed on a Decent Espresso Machine DE1PRO v1.1. The only component intentionally compared was the shower screen:
Grinding was performed using a Mahlkönig EK43 S fitted with SSP "High Uniformity" burrs with Silver Knight coating.
A VST 15 g ridgeless filter basket was used, with a target brew ratio of 1:3.
Water
The test water was Montille water from Le Mont-Dore, France. It was adjusted to 50 ppm as CaCO₃ alkalinity and 125 ppm as CaCO₃ total hardness.
The mineral adjustment was made using sodium carbonate and Epsom salts.
Controlling the water composition was important because mineral composition can influence extraction and therefore had to remain constant while the shower screens were compared.
Thermal preparation
The portafilter was preheated in a kettle to 80°C.
Before every shot, both the filter basket and shower screen were completely dried with a clean tissue. This eliminated residual water as a source of variation in puck preparation and initial wetting.
All extraction stages were run with a target coffee temperature of 90°C.
Coffee preparation
The beans were stored frozen and single-dosed. Each dose was ground into a double-walled stainless-steel cup.
Puck preparation was deliberately standardized:
The extensive preparation protocol was intended to minimize distribution and tamping inconsistencies so that differences observed during extraction would be more closely associated with the shower-screen configuration.
Extraction profile
A hybrid "Lever-Blooming" profile was used. It combined elements of a Londinium-style lever profile and a blooming extraction.
Here's the screens of the individual profile steps:

The programmed sequence was as follows:
Step 0 – "Lock portafilter!"
Step 1 – Preinfusion
Thus, the 20-second value acted as a maximum rather than necessarily determining the actual preinfusion duration.
Step 2 – Low-pressure bloom
This created a pressurized blooming period after initial saturation.
Step 3 – Flow rise
Rather than abruptly imposing the extraction flow, the machine gradually increased flow to the final target.
Step 4 – Hold flow
The extraction then continued under flow priority until the target beverage output was obtained.
Extraction-yield measurements
Total Dissolved Solids were measured with an Atago PAL refractometer.
The instrument was zeroed using the same adjusted Montille water used for brewing. Coffee samples were not filtered before measurement.
Before measurement:
TDS measurements were then used to determine Extraction Yield.
Radial extraction measurements
The experiment also examined whether the puck was extracted uniformly from its center to its circumference.
Essentially, the puck was divided into three concentric regions:
Ribes places the center of the basket at 0 mm and the basket wall at approximately 29 mm radius, with the central sampling region extending to approximately 18 mm before the intermediate and outer annular regions.

A local EY was determined for each radial zone:
The final espresso itself was measured separately to obtain the overall beverage EY.
This allowed the experiment to distinguish between a shot having a high average EY and a shot extracting uniformly throughout the puck. Those are not necessarily the same thing.
4. Proceeding
Three principal shots were used for the shower-screen comparison. Here's the charts:

Shot 1: IMS CI 200 IM reference
The reference shot used:
This established the hydraulic and extraction behavior of the CI screen.
During the main extraction stage, pressure rose to approximately 6.4 bar. Once the target flow was established, pressure fell comparatively rapidly and eventually approached roughly 2.5 bar.
Shot 2: IMS SI 200 IM at identical dose and grind
The screen was then changed to the IMS SI 200 IM, while the two most important puck-resistance variables were deliberately left unchanged:
This was the direct same-dose, same-grind comparison.
The resulting pressure curve was dramatically different. Instead of peaking around 6–7 bar, pressure climbed to almost 12 bar. It subsequently decreased but remained at approximately 8 bar late in the extraction.
This demonstrated that merely substituting the SI 200 screen substantially altered the hydraulic behavior.
However, because pressure was now very different, Shot 2 could not by itself provide a clean comparison of the screens under equivalent extraction pressure.
Shot 3: IMS SI 200 IM adjusted to approximately match pressure
A third shot therefore retained the SI 200 screen but changed the recipe to reduce puck resistance and bring the peak pressure closer to that of Shot 1:
Peak pressure was approximately 7.2 bar, much closer to Shot 1.
The critical comparison was then between:
This permitted the two pressure curves to be compared in a similar range while acknowledging that dose and grind had been deliberately changed.
Post-extraction puck examination
After every shot, the basket, puck and shower-screen contact were visually inspected.
The physical condition of the SI-screen pucks differed noticeably from the CI-screen puck.
5. Results
5.1. The SI 200 produced much higher pressure at the same dose and grind
The most immediate result came from comparing Shots 1 and 2.
Both shots used:
Yet their pressure curves were radically different.
With the CI 200, peak extraction pressure was approximately 6.4 bar.
With the SI 200, pressure climbed to almost 12 bar.
The SI screen therefore caused the system to exhibit substantially greater effective hydraulic resistance under otherwise comparable preparation conditions.
The experiment does not establish that the metal mesh itself was simply "more restrictive." The later puck observations indicate that altered shower-screen-to-puck clearance and the resulting interaction with an expanding puck are also relevant. What can be stated directly is that changing to the SI screen dramatically altered the pressure response.
5.2. Matching pressure required a lower dose and a coarser grind with the SI 200
To bring the SI-screen shot back into approximately the same pressure range as the CI-screen reference, both resistance-related variables were reduced:
This produced a peak of about 7.2 bar.
The need to make those changes reinforces how strongly the screen configuration affected shot hydraulics.
5.3. Pressure declined more gently with the SI 200
Once peak pressures were brought into a comparable range, another difference became visible.
With the CI 200, pressure fell relatively sharply after its peak. The curve declined from approximately 6.4 bar toward roughly 2.5 bar.
With the adjusted SI 200 shot, pressure declined more gradually, from roughly 7.2 bar toward approximately 4.5–5 bar late in the shot.
Thus, the SI 200 did not merely change the peak pressure. It was also associated with a gentler pressure decrease during the constant-flow stage.
A gentler decline means that the puck maintained resistance to water flow more effectively as the extraction progressed.
5.4. Overall extraction yield was slightly higher with the SI 200
The measured overall extraction yields were:

At identical dose and grind, the SI screen yielded 0.6 percentage points more extraction than the CI screen, although that comparison also involved a radically higher pressure.
The more meaningful pressure-adjusted comparison was Shot 1 versus Shot 3. Despite using both a lower dose and a coarser grind, the SI shot still reached an EY of 22.0%, versus 21.7% with the CI screen.
The difference was small—+0.3 EY percentage points—but notable because the coarser grind would not ordinarily be chosen to maximize extraction.
5.5. Taste differences were minor
The experiment reported no major taste difference between Shot 1 and Shot 3.
The only sensory distinction noted was slightly lower acidity with the IMS SI 200.
Consequently, the measurable changes in pressure behavior and radial extraction were larger than the observed sensory difference in this particular comparison.
5.6. The SI 200 produced drier, more solid spent pucks
The physical pucks provided another clear distinction.
After extraction, the pucks produced with the IMS SI 200 screen were drier and more solid than the puck produced with the IMS CI 200. Here's the photos showing the pucks, in which the spent puck from the IMS CI 200 IM shower screen is noticeably wetter:

This suggests that the SI configuration constrained the puck differently during extraction and helped it retain a more coherent structure after brewing.
5.7. Puck swelling caused contact with the SI 200 screen
The dry puck initially had only an estimated 1 mm of clearance below the IMS SI 200 screen.
During brewing, the grounds were estimated to swell by more than 3 mm.
Because the swelling exceeded the initial clearance, the coffee puck necessarily contacted the shower screen during extraction.
This interaction was strong enough that, after Shots 2 and 3, the puck remained stuck to the shower screen when the portafilter was removed. The imprint of the shower screen is visible in the pucks of shot 2 and 3:

This is an important mechanical result. It provides a plausible physical context for both the higher resistance and the greater stability of the pressure curve: with very little headspace, the swelling puck becomes mechanically constrained by the shower screen instead of expanding freely upward.
5.8. All three shots remained radially non-uniform
The radial measurements reveal that none of the screens created perfectly uniform extraction.
The local EYs were:

The dominant pattern is immediately visible: the center and middle of the puck extracted much more strongly than the outer edge.
For the CI 200 reference:
The center-to-edge difference was therefore approximately 8.7 EY percentage points.
This indicates severe underextraction around the circumference of the coffee bed even though the average beverage EY was a respectable 21.7%.
5.9. The SI 200 improved the outer-puck extraction
With the adjusted SI-screen shot:
The center and middle values were essentially unchanged relative to the CI reference, but the outer section rose from 16% to 18%.
The center-to-edge spread consequently decreased:
The radial spread therefore narrowed by approximately 2.1 EY percentage points.
The improvement did not come from extracting the already highly extracted center harder. Instead, most of the gain appeared at the region that needed it most: the perimeter of the puck.
This is why the slightly higher overall EY of the SI-screen shot is consistent with a more uniform radial extraction.
6. Conclusion
Taken together, the experiment indicates that changing from the IMS CI 200 IM to the IMS SI 200 IM alters the mechanical interaction between the shower screen and puck, substantially changes shot hydraulics, and appears to modestly improve extraction efficiency primarily by reducing underextraction at the outer edge of the coffee bed. The findings can be summarized by answering the original questions directly:
1. At the same coffee dose and grind setting, does replacing the IMS CI 200 IM with the IMS SI 200 IM change the extraction-pressure profile?
2. When dose and grind are adjusted to obtain a comparable peak pressure, does the IMS SI 200 IM still alter the pressure decline or total extraction yield?
3. Does changing from the IMS CI 200 IM to the IMS SI 200 IM produce a noticeable difference in taste?
4. Does the IMS SI 200 IM change the physical condition and behavior of the coffee puck after extraction?
5. Does the IMS SI 200 IM improve the radial uniformity of extraction between the center, middle, and outer regions of the puck?
Therefore, the principal extraction advantage of the IMS SI 200 IM was not a further increase in the already highly extracted center. Instead, it reduced some of the severe extraction deficit at the perimeter of the puck. This more even radial distribution is the most plausible explanation offered by the experiment for why the SI 200 achieved a slightly higher overall extraction yield even when it was paired with a lower dose and coarser grind.
The IMS SI 200 IM therefore appears to provide greater puck constraint, higher hydraulic resistance, a more stable late-shot pressure curve, a drier and more coherent spent puck, and moderately better radial extraction uniformity than the IMS CI 200 IM under the conditions tested. Its improvement was measurable but not absolute: the outer edge remained significantly less extracted than the center, and the observed sensory advantage was small.
10g espresso dose: better in a 7g or in a 15g basket?

1. Introduction
In May 2020, Stéphane Ribes documented an experiment asking a practical espresso question: when using a 10 g coffee dose, is it better to use a nominal 7 g single basket or a 15 g double basket? The slides of his presentation can be found here . The reference configuration was a VST 15 g basket, while the alternative was the Decent 7 g basket.
This was not a simple test in which the basket alone was changed and every other parameter held fixed. Instead, the objective was to determine what changes were necessary to make a 10 g dose function sensibly in the geometrically very different 7 g basket. The experiment therefore progressively modified shower-screen geometry, grind size, extraction flow and brew ratio, then compared extraction yield (EY), total dissolved solids (TDS), pressure behavior and qualitative cup characteristics.
The central result is clear: a 10 g dose can produce a pleasant espresso in the 7 g single basket, but it requires substantial retuning and still does not reproduce the extraction performance of the 15 g basket. The final 7 g-basket shot reached only 12.1% EY and 5.5% TDS, versus 20.0% EY and 7.6% TDS in the 15 g reference. The 7g basket also produced less crema and a thinner body.
2. Questions asked
Ribes' presentation addresses five closely related questions:
These questions reconstruct the experimental logic of the slides from the stated comparison, the tuning sequence and the reported observations.
3. Method
Experimental setup and preparation
The experiment used a Decent Espresso DE1PRO v1.1 fitted with a red Cafelat 8.0 mm silicone gasket. The following two basket/screen combinations were compared, whereby the 7g basket was called single filter basket and the 15g basket double filter basket in the presentation:

The different shower screens were deliberate. Ribes wanted to maintain approximately 4 mm of clearance between the coffee puck and shower screen in both configurations. The CI 200 screen was therefore used with the much shallower 7 g basket.
Grinding was performed with a Mahlkönig EK43 S fitted with SSP “High Uniformity” burrs with Silver Knight coating. Water was Montille water from Le Mont-Dore, France, adjusted with sodium carbonate and Epsom salts to 40 ppm as CaCO₃ alkalinity and 90 ppm as CaCO₃ total hardness.
Portafilters were preheated to 70 °C in a kettle. The basket and shower screen were completely dried before every shot. Beans were single-dosed and ground while frozen into a double-walled stainless-steel cup. For distribution, Ribes used WDT directly in the basket with a Londinium tool and Decent funnel, followed by gentle raking to create a uniform surface. For tamping, he used a Force Tamper with a 58.5 mm smooth flat base at 33 lb, rather than its 24 lb standard force.
TDS was measured with an Atago PAL refractometer, zeroed using the adjusted Montille water. Coffee samples were not filtered, were vigorously stirred and measured at room temperature. Each reported TDS data point was the average of three to five refractometer measurements of the same coffee sample.
Coffee
The package shown on page 6 of the presentation identifies the coffee as OR Coffee Roastery, Brasil – Sitio das Pedras, processed as a fermented natural and roasted as a filter roast.
Important experimental limitation
This is best understood as a tuning comparison, not a strictly controlled one-variable basket experiment. Changing from the 15 g to the 7 g basket also required changes in shower screen, grind, flow profile and eventually brew ratio. Consequently, the experiment shows how the two systems perform when individually adapted, but it cannot attribute every difference exclusively to basket geometry.
4. Proceeding
Establishing the 15 g-basket reference
The 10 g dose in the VST 15 g basket was used as the reference. Its principal settings and results were:
The graph of the reference shot shows a controlled initial flow/preinfusion phase followed by extraction. Pressure builds progressively during the extraction rather than immediately jumping to an extreme value. This became the hydraulic behavior Ribes attempted to approximate with the 7g basket.
Here's the chart of the 15g shot, which he tried to replicate with the 7g basket:

Step 1: adapting the grind to the 7 g basket
The first major problem appeared as soon as the same EK1.1 grind was used in the 7 g basket. Here's the first shots with the 7 g basket, with gradually adjusted grind settings:

The 7 g basket has a much narrower perforated section: approximately 29 mm in diameter compared with 49 mm for the double basket. Ribes estimates that its perforated surface area is therefore approximately 65% lower.
That figure is also geometrically consistent with the indicated diameters:
(29/49)^2≈0.35
so the smaller basket has only about 35% of the perforated area, or roughly 65% less.
The practical consequence was very high hydraulic resistance. In the pressure plots above it's visible that using EK1.1 in the 7 g basket drives pressure rapidly to a very high plateau. Progressively coarsening the grind changes the hydraulic behavior, as visible in the charts above. For easier comparison, the resulting EY are also listed below:

The final required setting was EK2.2, corresponding in the slides to approximately a 90 µm burr gap, compared with approximately 45 µm at EK1.1. In other words, the burr gap had to be approximately doubled.
An important chart-level observation follows from these values: coarsening the grind solved a hydraulic problem, but it did not solve the extraction-yield problem. Across the four 7 g-basket grind settings, EY remained clustered around 12.3–12.6%. It never approached the reference value of 20%.
Ribes interprets the need for such a coarse grind primarily as a consequence of the much smaller perforated area of the single basket. This is presented as a likely explanation rather than demonstrated as a separate causal test.
Step 2: reducing extraction flow
Even at EK2.2, pressure remained undesirable at the higher extraction flow. The next intervention was therefore to reduce extraction flow from 2.7 mL/s to 1.7 mL/s.
The purpose was explicitly hydraulic: reduce extraction pressure and prevent channeling and spraying. The length of the flow ramp was also reduced so that the rate at which water flow increased remained approximately constant.
Below are the charts comparing shots 8, 9 and 10 for reference:

The charts above are particularly informative here. At 2.7 mL/s, the green pressure trace rises very steeply late in the shot and approaches the high end of the plotted pressure range. At 1.7 mL/s, the pressure trajectory becomes substantially lower and smoother, peaking at roughly the 6-bar region rather than approaching roughly 9 bar.
Yet TDS and EY remain exactly the same in the reported measurements: 4.8% and 12.4%.
That means the reduction in flow was valuable primarily for hydraulic stability and pressure control, rather than because it directly increased extraction.
Step 3: shortening the brew ratio
With extraction yield still low, Ribes then changed the output mass instead of trying to force higher extraction from the puck.
Shot 10 (shown above under step 2) retained the 1.7 mL/s flow but stopped at 22 g out from 10 g in, giving a 1:2.2 brew ratio, compared with 26 g / 1:2.6 previously:
This produces one of the most important distinctions in the experiment: concentration and extraction yield are not the same thing.
Using the standard espresso EY relationship as an interpretive check,

Shot 9 gives approximately: 26×0.048/10≈12.5%
while Shot 10 gives: 22×0.055/10≈12.1%
So the shorter shot did not extract more material from the coffee. In fact, EY decreased slightly. What it did was put a similar amount of extracted coffee solids into less beverage, thereby raising concentration from 4.8% to 5.5%.
That increased concentration appears to have helped the sensory result. Ribes describes the final shot as more balanced, brighter and no longer bitter relative to the previous shot.
Visual assessment
In his presentation, Ribes included photographs of the two preparations side by side, apparently documenting the grounds/puck before extraction, the tamped surface, the espresso in the cup, the spent puck and the basket after puck removal.
The cup photographs qualitatively support the explicit observation elsewhere in the deck that the 7 g configuration produced less crema. Ribes also reports a thinner body with the 7 g basket.

The knocked-out 7 g puck also appears less intact around its perimeter than the 15 g puck, although Ribes does not explicitly interpret puck integrity, so this should not be treated as a measured result.

One further documentation gap should be noted: the presentation shows shots 0–4 and then 8–10. Shots 5–7 are not shown, so the complete tuning path between the grind-adjustment phase and the final flow experiments cannot be reconstructed.
5. Results
Final tuned comparison

In his presentation, Ribes reported that adapting the 10 g dose to the 7 g basket required substantial changes relative to the VST 15 g reference: maintaining roughly 4 mm puck-to-screen clearance with an IMS CI 200 shower screen, grinding much coarser from EK1.1 to EK2.2, lowering the extraction flow rate to reduce pressure and limit channeling and spraying, and shortening the flow ramp. Even after these adjustments, extraction performance remained markedly lower: extraction yield fell from 20.0% to 12.1% and TDS from 7.6% to 5.5%. Reducing the brew ratio from 1:2.6 to 1:2.2 partly compensated for the low extraction yield by increasing beverage concentration and produced what Ribes described as a more balanced and quite pleasant shot. However, the 7 g basket still produced less crema and a thinner body than the 15 g reference.
Magnitude of the extraction difference
The final 7 g-basket EY of 12.1% is 7.9 percentage points below the 20.0% reference. In relative terms, it represents only about 60.5% of the reference extraction yield, or a roughly 39.5% reduction.
Similarly, TDS falls from 7.6% to 5.5%, a decline of 2.1 percentage points, or roughly 28% relative to the reference.
The smaller brew ratio partly compensates for the low extraction by concentrating the beverage, but it cannot fully recover the concentration of the double-basket shot. This is exactly what Ribes means by saying that shortening the ratio could “partly offset” the low EY's impact on TDS.
What the charts collectively demonstrate
The sequence of DE1 plots reveals three separate phenomena.
First, basket geometry changes puck hydraulics dramatically. The narrow 29 mm perforated region in the single basket is substantially more restrictive, requiring a grind that would normally be considered extremely coarse relative to the double-basket reference.
Second, hydraulic optimization and extraction optimization are not identical. Moving from EK1.1 to EK2.2 and then from 2.7 to 1.7 mL/s makes the single basket easier to control, lowers pressure and is intended to reduce channeling and sprays, but EY remains at about 12%.
Third, brew ratio can modify cup concentration independently of extraction yield. Shortening the output from 26 to 22 g raises TDS from 4.8 to 5.5%, even though EY falls slightly from 12.4 to 12.1%. This is why the final shot can become more satisfying despite the underlying extraction remaining low.
This distinction is the most useful general lesson contained in the deck: a better-tasting espresso after a recipe adjustment does not necessarily mean that extraction yield has increased.
6. Conclusion
Taken together, the experiment supports the following answers to the questions posed above:
1. For a 10 g dose, can the 7 g Decent basket produce a shot comparable to the VST 15 g reference basket?
2. What mechanical and extraction-profile changes are required to make the 7 g basket workable?
3. How does the much smaller perforated area of the 7 g basket affect grind requirements and extraction hydraulics?
4. What do a lower extraction flow rate and a shorter brew ratio do to pressure, TDS, extraction yield and taste?
5. Under the tested conditions, which basket is the more suitable choice for a 10 g espresso dose?
The broader implication should be kept narrow: this research provides a strong case study of how basket geometry, grind resistance, pressure, flow, extraction yield and beverage concentration interact, but it does not establish a universal rule for every single versus double basket. The evidence applies directly to the specific Decent/VST baskets, coffee, grinder, water and preparation protocol tested here.
Effect of Development Time Ratio (DTR) on Kaffelogic-roasted espresso: a comparison of 10% and 15% DTR

Introduction
In May 2020, Stéphane Ribes conducted research comparing different Development Time Ratios on his Kaffelogic Nano 7 roaster. The slides of his presentation can be found here.
The experiment compares two 90 g coffee roasts produced using the same “LightSide” roast profile but different Development Time Ratios (DTR): 10% and 15%. The roasted coffees were then prepared as espresso on a Decent Espresso machine and evaluated through extraction data, pressure/flow graphs, TDS and extraction-yield measurements, and sensory comparison.
The central purpose is therefore not simply to compare two roast curves. It is to investigate how extending development after first crack affects the coffee as an espresso: its physical extraction behavior, measured concentration and yield, and ultimately its sensory character.
2. Questions asked
The following questions can be inferred from Ribes' experiments:
3. Method
Coffee
The coffee used was a washed, green Yirgacheffe, variety Kurume, from Mr. Tessema Edima in Ethiopia.
Roasting equipment and experimental variable
Both batches were roasted on a Kaffelogic Nano 7:
The experimental variable was DTR.

From those times, the actual development periods can also be calculated:
Thus Roast 2 had 28 seconds more post-first-crack development, approximately a 55% increase in absolute development time. The total roast itself was only 22 seconds longer, because first crack occurred six seconds earlier in Roast 2.
The roast-end temperature increased by 3°C, from 215°C to 218°C. Weight loss increased by 1.1 percentage points, from 12.1% to 13.2%.
Espresso equipment
The setup of Ribes' experiment consisted of:
Water
Montille water from Le Mont Dore, France, was adjusted to 40 ppm as CaCO₃ alkalinity and 90 ppm as CaCO₃ total hardness.
Sodium carbonate and Epsom salts were used for the adjustment.
Puck preparation
The preparation procedure was tightly standardized:
These details indicate a deliberate attempt to reduce variation from puck preparation.
TDS measurement
TDS was measured with an Atago PAL refractometer:
Intended extraction profile
The extraction-profile slide by Ribes gives the following target assumptions:

Below is the profile used to brew the shots:

The profile shows approximately nine seconds of preinfusion and a predicted total shot time of 34 seconds. Flow initially rises to about 5 mL/s, falls during the low-pressure/bloom stage, and then rises toward 2.6 mL/s. Pressure reaches approximately 2.2 bar during the bloom and then rises to roughly 6.5 bar before gradually declining while flow is held approximately constant.
4. Proceeding
The experiment proceeded in two principal stages.
First, two 90 g batches of the same coffee were roasted using the Kaffelogic LightSide profile. The first was stopped at 8:24, producing a 10% DTR, while the second roast continued to 8:46, producing a 15% DTR. First crack was recorded for each roast, together with roast-end temperature and subsequent weight loss.
The roast graphs illustrated below show that the overall temperature trajectories were very similar.

In both cases the measured temperature curve tracks the selected LightSide trajectory reasonably closely after the initial turning phase. The actual rate-of-rise curve oscillates around its smoother target but broadly declines as the roast progresses. Power is reduced sharply during the early phase and then progressively increased until the roast is terminated. The second roast largely continues the same general trajectory for longer instead of being produced with a fundamentally different early-roast profile.
First crack was not exactly identical between the batches: Roast 2 cracked six seconds earlier and approximately 1°C cooler. Consequently, the comparison is very close to an “extended development” experiment, but not a perfectly identical roast up to first crack.
Second, espresso was prepared with:
The Roast 1 espresso used 19.5 g in and 50 g out.
For Roast 2, the dose was deliberately reduced to 18 g, producing 46 g out, because Ribes adjusted the quantity of coffee to obtain the same extraction pressure.
The resulting brew ratios are identical:
So the dose changed, but the beverage ratio was effectively held constant.
After extraction, TDS and extraction yield were determined, and the shots were tasted comparatively.
5. Results
5.1. Roast development
Increasing the target DTR from 10% to 15% changed several physical roast outcomes.
Roast 2 finished:
and had 79 rather than 51 seconds of post-first-crack development.
This is consistent with Roast 2 being meaningfully more developed, even though both were still presented as relatively light/City-style roasts.
The curves are important because they show that this was not a comparison between radically different roasting strategies. The general temperature, power and declining-ROR patterns remained similar. Most of the experimental difference was introduced near and after first crack by allowing the second roast to proceed further.
However, the experiment does not perfectly isolate DTR. First crack itself differed slightly between batches, occurring at 7:33/208°C versus 7:27/207°C.
5.2. Espresso extraction measurements
The central quantitative results were:

Two things are particularly notable.
First, the higher-DTR roast required less coffee to reach the same extraction pressure at the same grind setting and with the same general extraction program. The dose fell from 19.5 g to 18 g, a reduction of approximately 7.7%.
That strongly suggests that roast development altered how the coffee bed behaved hydraulically. In practical terms, less of the 15% DTR coffee was needed to create approximately the same pressure response. This is an inference from the dose adjustment rather than a direct measurement of a material property such as permeability.
Second, the higher-DTR espresso produced lower TDS and lower extraction yield:
The target specified elsewhere was 8.0–8.5% TDS. Both measured shots therefore exceeded the stated target, although the 15% DTR shot at 8.6% was considerably closer to it.
5.3. Analysis of the actual espresso graphs
The actual shot screens below support the claim that the two shots had closely comparable hydraulic profiles:

Both graphs show a broadly similar blue flow trajectory and green pressure response. Flow initially reaches roughly 5 mL/s, falls sharply in the middle phase, and subsequently rises toward approximately 2.5–2.7 mL/s. Pressure responds with an initial low-pressure phase followed by a later peak and gradual decline.
The approximate maximum pressure is similar in the two plotted shots—visually around the mid-4-bar range—indicating that the dose adjustment did what it was intended to do: bring the two extractions to comparable pressure behavior.
The Roast 1 screenshot additionally records approximately:
The Roast 2 display records approximately:
Thus the second shot was approximately three seconds shorter in the recorded actual extraction.
5.4. Sensory results
The strongest result of the experiment was sensory rather than analytical.
According to the presentation, the 15% DTR espresso had:
compared with the 10% DTR espresso.
This is especially interesting because the 15% DTR shot was perceived as more intense despite having lower TDS: 8.6% versus 8.9%. It also had the lower extraction yield, 22.1% versus 23.1%.
In other words, perceived intensity in this experiment did not simply track the amount of dissolved material in the cup.
Increasing development changed the character of those dissolved compounds—or at least the sensory balance created by them—toward more bitterness and body and away from acidity and clarity.
This is arguably the presentation's most important finding.
The photographs below of the finished cups show both shots with substantial crema. Roast 2 appears somewhat darker in the photograph, but this cannot be regarded as controlled color evidence because cup position, exposure and crema state are not standardized.

5.5. What the measurements do and do not demonstrate
The experimental comparison is useful, but several limitations affect how strongly its conclusions can be generalized.
First, dose was not held constant. Roast 1 used 19.5 g, whereas Roast 2 used 18 g. This was intentional—to match extraction pressure—but means the experiment tests the coffees under a matched-pressure strategy, not under strictly identical dose conditions.
Second, no independent espresso replicates are reported. The protocol states that a data point represents 3–5 measurements of each coffee sample, but these appear to be repeated refractometer measurements of one sample, not 3–5 separately prepared shots.
Third, no blind or randomized sensory protocol is documented. The slides give clear tasting impressions, but there is no information concerning multiple tasters, blindness, tasting order or statistical analysis.
Fourth, the extraction-profile documentation is internally inconsistent, particularly regarding brew temperature, preinfusion time and total shot time.
Fifth, Roast 1 and Roast 2 were not perfectly identical before development. First crack occurred six seconds earlier and 1°C cooler in Roast 2.
The study should therefore be treated as a carefully documented exploratory comparison, rather than a controlled experiment capable of establishing a universal causal law about DTR.
6. Conclusion
The presentation provides a compact but informative demonstration of how a relatively small change in roast development can materially alter espresso behavior and taste. Extending DTR from 10% to 15% added only 22 seconds to total roast time and 3°C to final temperature, yet it increased weight loss, changed the dose necessary to obtain comparable extraction pressure, and produced a clearly different sensory profile.
Most importantly, the experiment demonstrates that sensory intensity and measured beverage concentration are not the same thing. The more developed coffee produced more body, bitterness and perceived intensity despite its slightly lower TDS and extraction yield.
1: What changes in the roast when Development Time Ratio is increased from 10% to 15% while using the same Kaffelogic “LightSide” profile?
2: Does the higher-DTR coffee behave differently during espresso extraction when grind setting and extraction profile are kept the same?
3: How do the two roasts differ in objective espresso measurements such as dose, beverage mass, TDS and extraction yield?
4: What sensory differences result from increasing DTR from 10% to 15%?
5: Can the higher-DTR roast produce greater perceived intensity even if its measured TDS and extraction yield are lower?
Overall, the evidence favors 10% DTR when the priority is floral/fruity character, acidity and flavor clarity, while 15% DTR shifts the same coffee toward body, bitterness and perceived strength without creating obviously unpleasant roast flavors. That final statement should remain specific to this coffee, equipment and procedure because the slides do not supply independent shot replication, blind tasting, or statistical testing.
#research #Ribes #coffee #preinfusion #puckprep #documentation #overview
john created 2026/10/27.